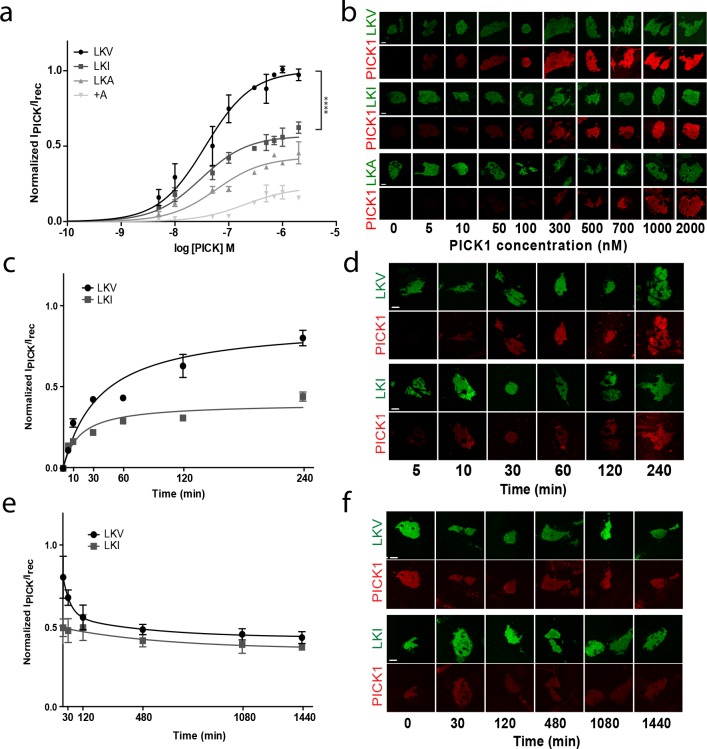
Figure 3. The intrinsic PDZ affinity does not translate directly to avidity but determines maximal binding.
(b) Normalized binding derived from SCMS as a function of PICK1 concentration to LKV (black) (Kd*=37 ± 5 nM, Bmax = 100%), LKI (dark grey) (Kd*=29 ± 4 nM, Bmax = 56 ± 2%), LKA (light grey) (Kd*=59 ± 11 nM, Bmax = 41 ± 4%) LKV +A (white) (Kd*not fitted, Bmax = 21 ± 3). n = 8, 7, 5 and 3, respectively (**p<0.01; ****p≤0.0001). (b) Representative images demonstrating concentration dependent binding of PICK1 to SCMS expressing LKV, LKI and LKA constructs. (c) Representative PICK1 binding to SCMS expressing LKV or LKI as a function of incubation time. PICK1 concentration is 100 nM. Half maximum binding values are 24 ± 14 min for LKV, and 11 ± 4 min for LKI (means ±s.e.m, n = 3). (d) Representative images showing time dependent PICK1 binding to LKV and LKI. (e) Representative PICK1 dissociation curves from SCMS expressing LKV or LKI (points are means ±SD). LKV is fitted to a two-state dissociation with estimated fast and slow half-life of 21 ± 8 and 373 ± 51 min., respectively. LKI is fitted to a one-state dissociation with a half-life of 431 ± 16 min. (means ± S.E, n = 3). (f) Representative images showing time dependent PICK1 dissociation from LKV and LKI. Scale bars 10 μm.


