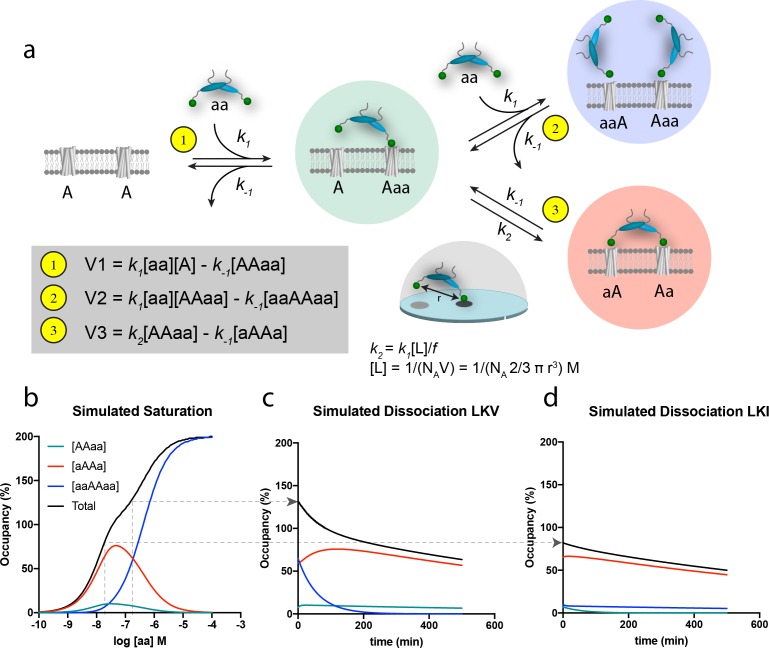
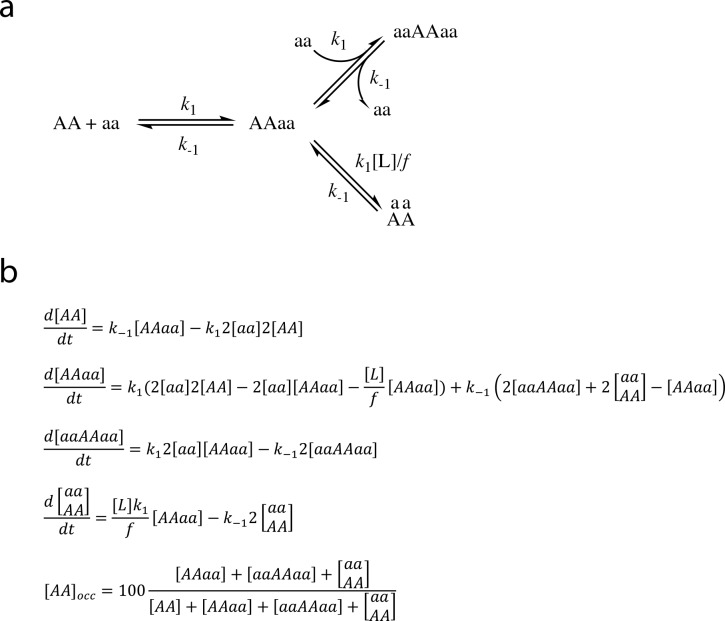
Figure 4. Schematic representation of the thermodynamic model for homobivalent ligand-target interactions and thereon-based simulated saturation and dissociation curves.
(a) Thermodynamic scheme for homobivalent ligand, ‘aa’- target, ‘AA’, interactions (see also Figure 4—figure supplement 1 for full scheme). The different binding modes in panel a are designated by ‘AAaa’ for the partially bound complexes (green), by ‘aAAa’ for the bivalently bound complex (red) and by ‘aaAAaa’ for ‘ternary’ complex with two partly bound ligands (blue). The rebinding kinetics is dependent the local concentration, [L], that is calculated as that of one molecule within a half-sphere with radius, r. Moreover, the rate constant is modified by f due to steric hindrance, restricted rational freedom and entropic cost. An f of 185 enables good qualitative simulation of our data (see also Figure 4—figure supplement 3 for behavior at other values of f). (b) Simulated saturation binding curve for binding of species. Input parameters: k1 = 1.85⋅105 M−1min−1, k-1 = 0.0085 min-−1, k2 = 0.136 min−1 (i.e. a composite rate constant such as defined in the figure). Total incubation time is 120 min. Analysis of the total signal according to a variable slope sigmoidal dose-response paradigm yields half-maximal signal at 50 nM. Note for these parameters the blue ‘ternary’ complex outpaces the red bivalent complex at bulk concentration of PICK1 above 100 nM. (c,d) Simulated dissociation curves after 120 min pre-incubation with 200 nM (c) and 20 nM (d) of the same homobivalent ligand as in panel c (corresponding to the affinity difference between LKV and LKI). [aa] is set and kept at 0 for simulating the ‘washout phase’.


