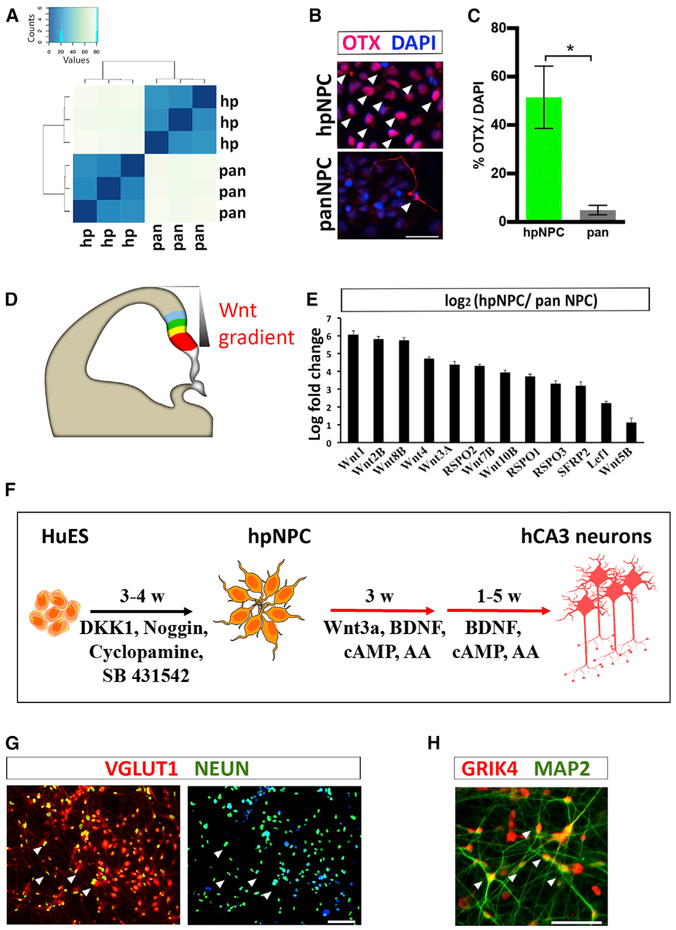
Figure 1. Generation of hCA3s from Human ESCs.
(A) Hierarchical clustering based on differential transcriptomes between hpNPCs (hp) and panneuronal NPCs (pan).
(B and C) Immunostaining (B) and quantitation (C) of OTX1/2 expression in hpNPCs and pan-NPCs. Arrowheads represent OTX+ NPCs. *p = 0.022.
(D) Schematic of E12 telencephalon showing the cortical hem (red), DG (yellow), and CA primordia (green and blue).
(E) Wnt signaling pathway is upregulated in hpNPCs (padj ≤ 1.87E-06)
(F) Schematic showing hCA3 differentiation paradigm.
(G) Arrowheads show VGLUT1+ (red) and neuronal marker NeuN+ (green) 4–5 WIV hCA3.
(H) Arrowheads show GRIK4+ MAP2+ neurons in hCA3 (4 WIV).
Results are presented as mean ± SEM. n = 3, *p < 0.05. Scale bar, 50 μm. See also Figure S1.

