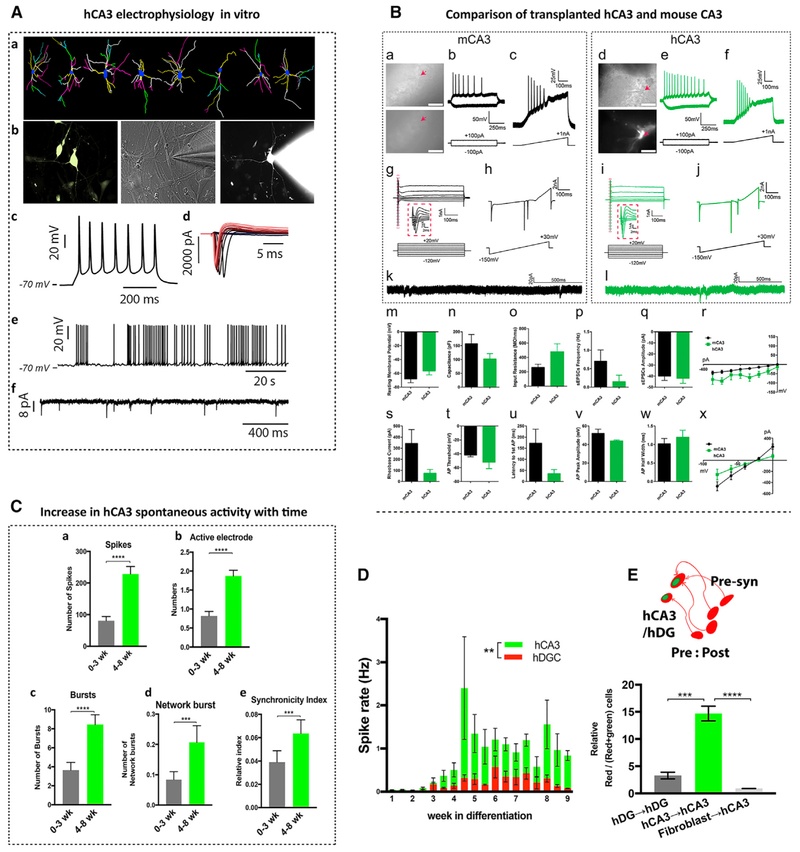
Figure 5. hCA3s Are Functionally Active.
(A) Electrophysiology of hCA3s. (a) hCA3 morphology at 4 WIV. Dendrites are color-coded from yellow, white, magenta, and green to pale yellow to show consecutive branch orders. Scale bar, 10 μm. (b) Whole-cell patch clamping of eGFP+hCA3 neurons (marked with lentiviral-Grik4-GFP or Elavl2-GFP reporter at 6 WIV). (c) An example of evoked AP (depolarizing step of 500 ms in current clamp). (d) Na+ and K+ current in response to a series of depolarizing steps in voltage clamp. (e and f) Examples of spontaneous AP in current clamp (e) and EPSCs recorded in voltage clamp (−70 mV) (f). See also Figures S4E–S4T.
(B) Comparison of transplanted hCA3s with mouse CA3 neurons. 7 mouse CA3s and 4 eGFP+hCA3 neurons were recorded from mouse hippocampal slices at 3–3.5 MPT. (a and d) 40× images (top, differential interference contrast [DIC]; bottom, epifluorescence) of patched mCA3 neurons(a) and hCA3 (d) in mouse brain slices. Scale bars, 100 μm. (b, c, e, and f) APs were evoked by somatic current injection steps (b and e) and ramps (c and f) in examples of a mCA3 (b and c) neuron and hCA3 (e and f). (g–j) Voltage steps (g and i) and ramps (h and j) elicit sodium spikes at depolarized potentials in an example of a mCA3 neuron (g and h) and hCA3 (i and j). (k and l) Spontaneous excitatory postsynaptic currents (sEPSCs) recorded from examples of mCA3 (k) and hCA3 neurons (l). (m) Resting membrane potentials (mV) (p = 0.1760), (n) capacitances (pF) (p = 0.2196), (o) input resistance (p = 0.0596), (p) sEPSC frequency (p = 0.3236), and (q) amplitude (p = 0.7628) of mCA3 and hCA3 neurons. (r) Current-voltage (IV) curves (generated from current injection steps) of mCA3 and hCA3 (repeated-measures two-way ANOVA, F(1,7) = 4.442, p = 0.0731, post hoc test multiple comparisons, Sidak’s multiple comparison test, not significant at all points). (s–w) Rheobase or current injection needed to elicit first AP from ramp (pA) (p = 0.2494), AP threshold (mV) (p = 0.1109), latency to first AP (ms) (p = 0.2438), AP peak amplitude (mV) (p = 0.3266), or AP half-width (ms) (p = 0.5140) is not significantly different between mCA3 and hCA3 neurons. (x) Current-voltage (IV) curves (generated from voltagesteps) of mCA3 and hCA3 (repeated-measures two-way ANOVA, F(1,7) = 0.4102, p = 0.5423, post hoc test multiple comparisons, Sidak’s multiple comparison test, not significant at all points. In (m)–(q) and (s)–(w), a two-tailed t test was performed. See also Figures S4E–S4T.
(C) Increase in spontaneous activity of hCA3 network with time (a–e). Number of spikes (****p < 0.0001) (a), active electrodes (****p < 0.0001) (b), bursts (****p < 0.0001) (c), network bursts (***p = 0.0002) (d), and synchrony index (***p = 0.0008) (e) over a 10-min MEA recording of hCA3s at 0–3 WIV (gray) versus 4–8 WIV (green). Number of recordings per group ≥ 7; number of neuronal cultures = 96.
(D) Spike rate (Hz) of hDG and hCA3s over a 10-min MEA recording. n = 3 neuronal cultures, recorded ≥2 times per week for 0–8 WIV and 1 time in the ninth WIV (**p = 0.0071).
(E) Schematic showing postsynaptic (green+red+) and presynaptic (red) neurons (left). hCA3 culture shows more connectivity (red+/red+green+) compared to hDGs and mouse irradiated fibroblasts in vitro (right). ***p = 0.0003 and ****p < 0.0001.
Results are presented as mean ± SEM (recorded on 12-well MEA plate). See also Figure S3 and S4.

