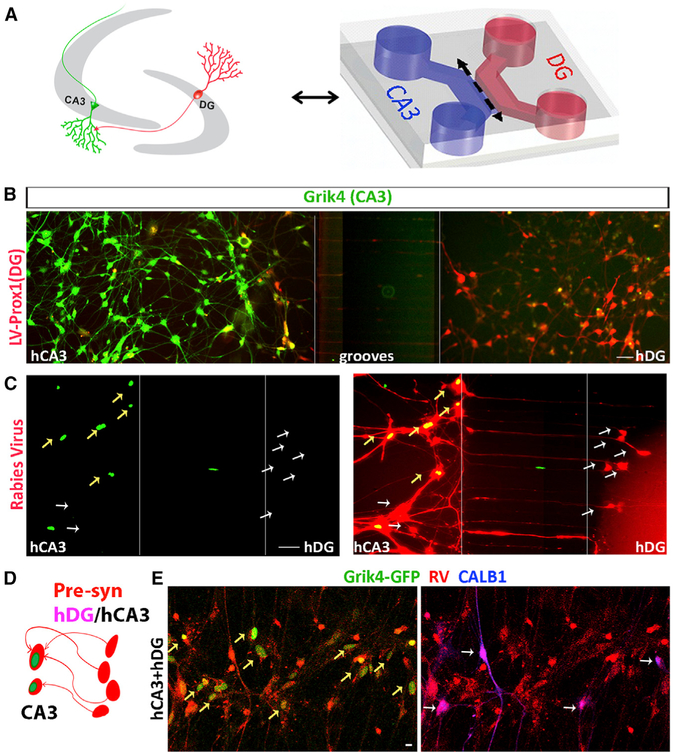
Figure 6. hCA3s Connect to hDGs.
(A) Reconstruction of DG-CA3 neuronal connection (left) in microfluidic devices (right).
(B) hCA3s and hDGs were transfected with LV-Grik4-tdTomato (shown in green) and LVProx1-GFP (shown in red), respectively.
(C) Rabies tracing in microfluidic devices containing hCA3 (left) and hDG (right). Postsynaptic hCA3s (yellow arrows) are labeled with LV-Grik4-G-GFP (green; C, left) and rabies virus (green+red+; C, right); rabies virus traces the presynaptic cells (white arrows) in the DG compartment (red).
(D) Schematic showing postsynaptic (green+red+), presynaptic (red) and CALB+ presynaptic (red+blue+) neurons.
(E) hCA3s are marked CA3-specific LV-Grik4-GGFP (green, yellow arrow) in DG-CA3 co-culture in combination with rabies tracing (red). Immunostaining showing hCA3 (green+red+), presynaptic neurons (red), and CALB1+ (blue, white arrows) presynaptic neurons (red+blue+) as traced by rabies virus (red). Scale bar represents 50 μm in (B) and (C) and 10 μm in (E).
See also Figure S5.

