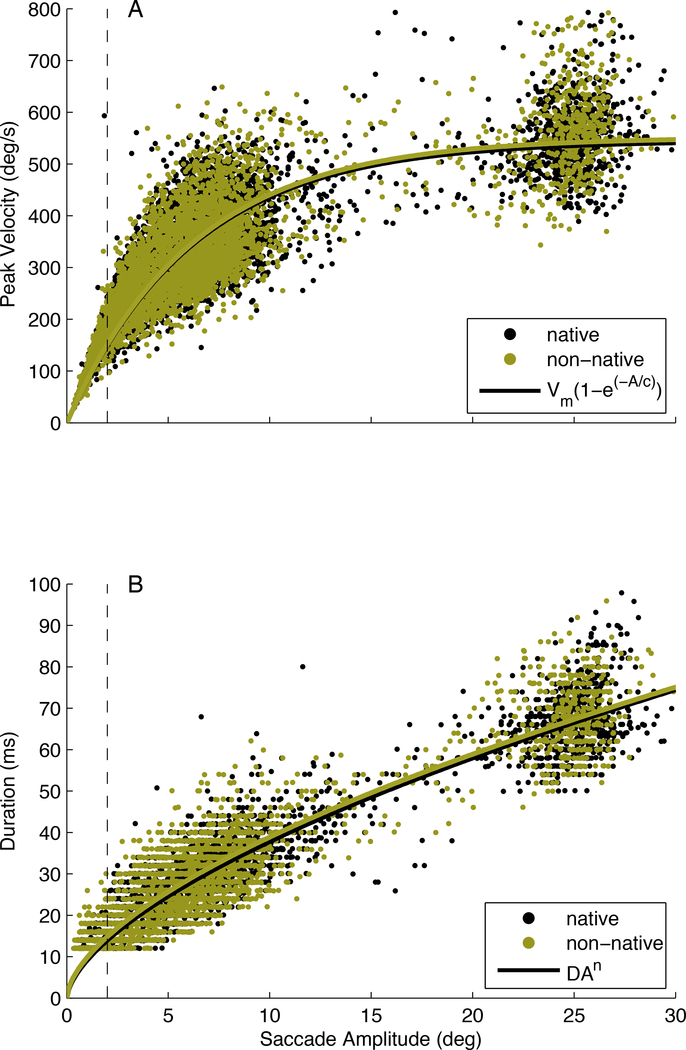
Fig. 3.
Main sequence plots of non-native and native English speakers for all saccades during the KD test. Dotted line demarcates task-specific saccades (2 degrees or greater) Top. Plot of peak velocity versus amplitude showing that as saccade amplitude increases, the peak velocity increases in an asymptotic distribution. Parameters: Non-native Vm = 551.6 deg/sec, c = 6.2; Native Vm = 545.4 deg/sec, c = 6.2. Bottom. Plot of duration versus amplitude. Parameters: Non-native D = 9.8 ms, n = 0.6; Native D = 9.1 ms, n = 0.6. No differences are seen in these relationships between non-native and native English speaking subjects in either plot.

