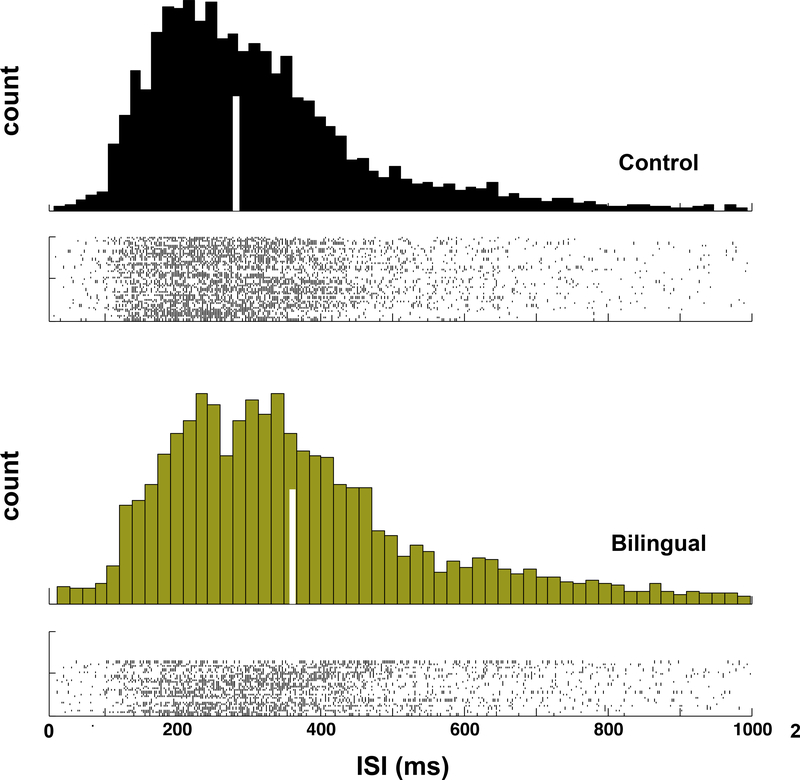
Fig. 4.
Distributions of inter-saccadic intervals in non-native (labeled Bilingual) and native (labeled Control) English-speakers. Histograms of inter-saccadic interval (ISI) values are plotted over subject-by-subject raster plots of the same data. Histograms highlight the overall distribution of ISI values, while rasters highlight any individual differences in the pattern of ISI values relative to the group.

