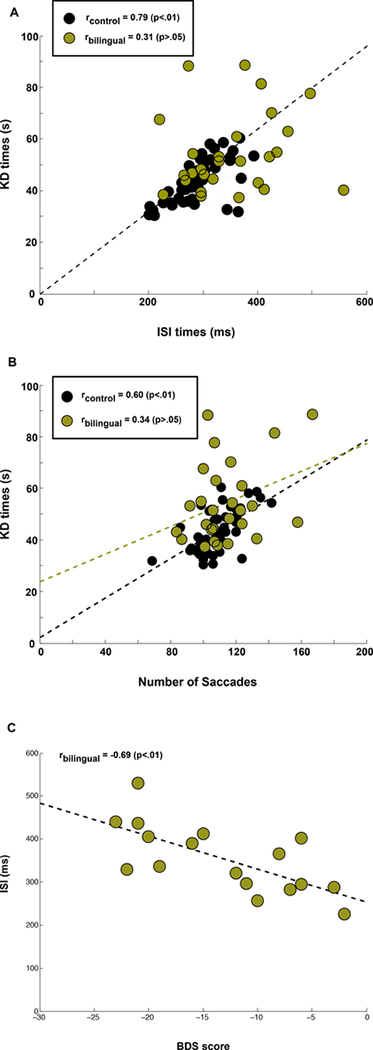
Fig. 5.
Correlation plots. Top. Correlations between median ISI values and KD test times. Middle. Correlations between the number of saccades below 20 degrees produced by each subject and that subject’s KD test time. Bottom. Correlation between ISI times and BDS scores for subjects producing negative BDS scores (displaying dominance in a language other than English). In all panels, dashed lines are the best-fitted line through the origin that minimizes total squared error of the fit.

