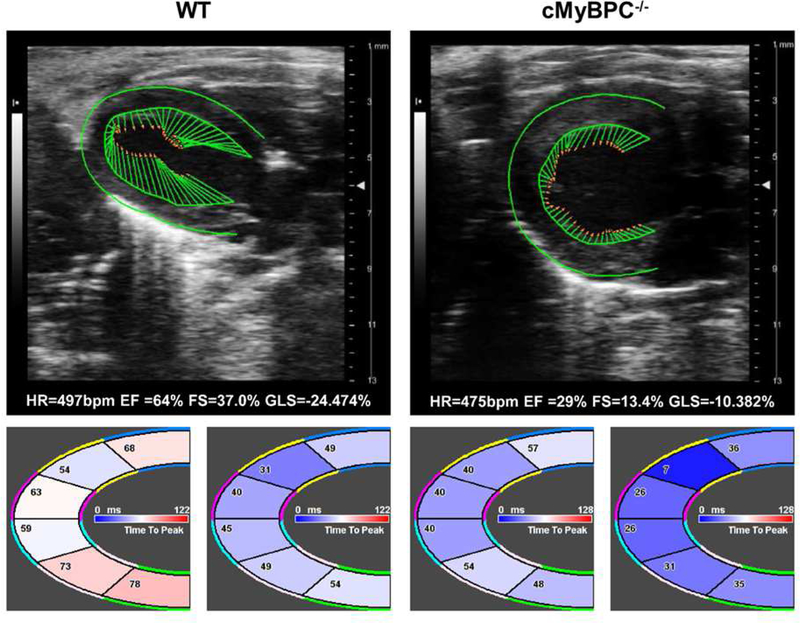
Figure 3. Representative speckle-tracking echocardiography (STE) analysis of WT and cMyBPC−/− mouse myocardium.
The top panel shows representative STE images along with the heart rate (HR), ejection fraction (EF), fractional shortening (FS), and global longitudinal strain (GLS) of WT (left) and cMyBPC−/− (right) mouse myocardium. The regional time-to-peak strain (left) and time-to-peak strain rate (right) are shown below WT and cMyBPC−/− STE images. Notably, cMyBPC−/− STE shows reduced GLS, shortened time-to-peak strain, and shortened time-to-peak strain rate.

