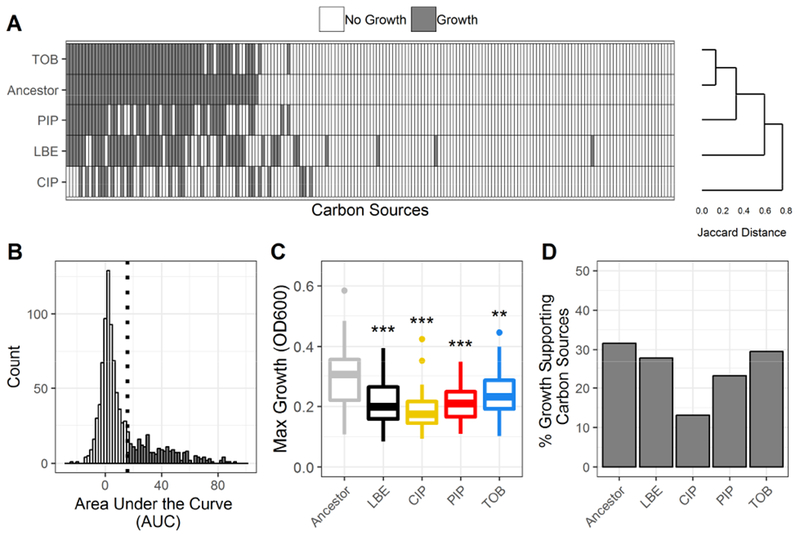
Figure 2. Summary of phenotypic growth data of antibiotic-resistant P. aeruginosa.

(A) Binary growth calls for each lineage (Ancestor, LBE = LB-Evolved, CIP = ciprofloxacin-resistant, PIP = piperacillin-resistant, TOB = tobramycin-resistant) across 190 unique carbon sources (white = no growth, grey = growth). Lineages are clustered using Jaccard distances and complete linkage. Carbon sources are sorted by growth calls for the ancestral lineage. (B) Histogram of the area under the curve (AUC) for all measured growth curves. A lineage was considered to have grown on a given carbon source if the AUC of the 48-hour growth curve was above the 3rd quartile. The growth/no growth cutoff is indicated by a dotted line. (C) Boxplot summarizes the maximum growth density by lineage across all carbon sources for which each lineage grew. Growth density was measured as the OD600 after subtraction of a negative control. Boxes encompass the 1st to 3rd quartile of each population. Whiskers extend up to 1.5 times the interquartile range from the closest box boundary. Data points that are out of the whisker range are outliers and are denoted by individual points. Significance relative to the ancestor denoted by Wilcoxon rank sum test with Benjamini-Hochberg correction (***P-value < 0.001, **P-value < 0.01, *P-value < 0.05). (D) Summary of the percent of total carbon sources that supported growth of each lineage.
