
Figure 4. Tobramycin-resistant PA14 exhibits enhanced growth on N-Acetyl-D Glucosamine.
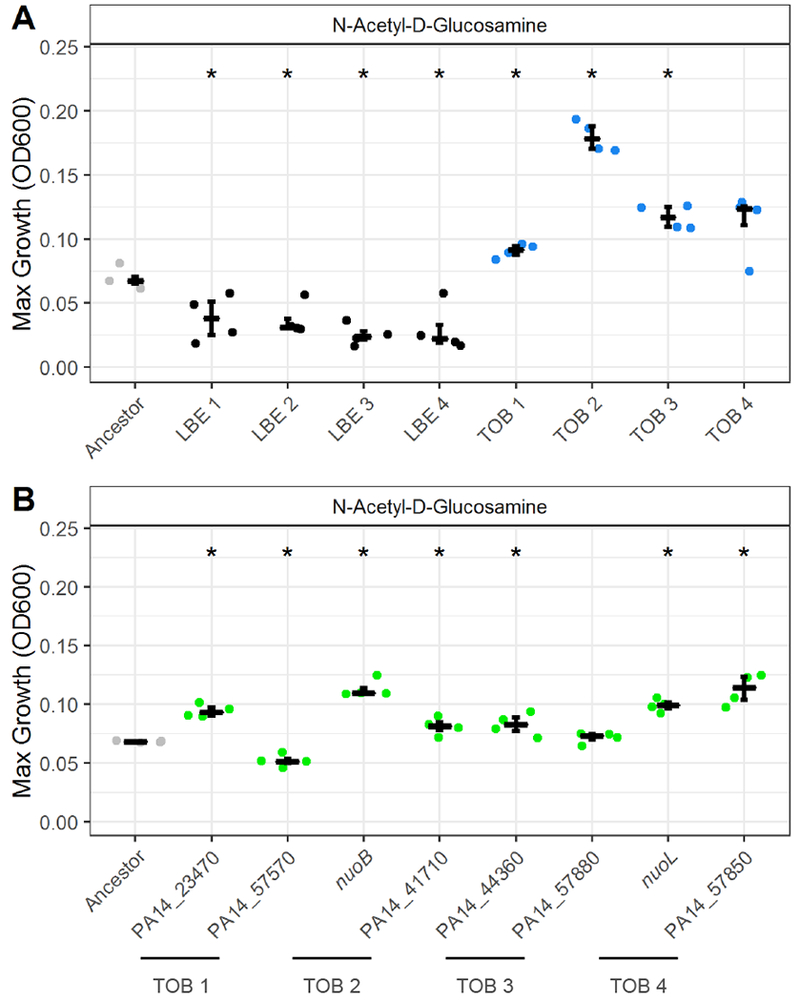
(A) Maximum growth (OD600) of four independent tobramycin-evolved lineages (blue) and four independent LB-evolved lineages (black) on 20mM of N-acetyl-D-glucosamine relative to the unevolved ancestor (grey). Numbers refer to replicate lineages from a previous study (Yen and Papin, 2017). TOB 3 and LBE 2 correspond to TOB and LBE from the phenotypic profiling analysis. (B) Maximum growth (OD600) of eight transposon mutants (green) on 20mM of N-acetyl-D-glucosamine relative to ancestor (grey). Significance relative to the ancestor determined by Wilcoxon rank sum test with Benjamini-Hochberg correction (*P-value < 0.05). Crossbar denotes median and error bars show the interquartile range of four replicate colonies.