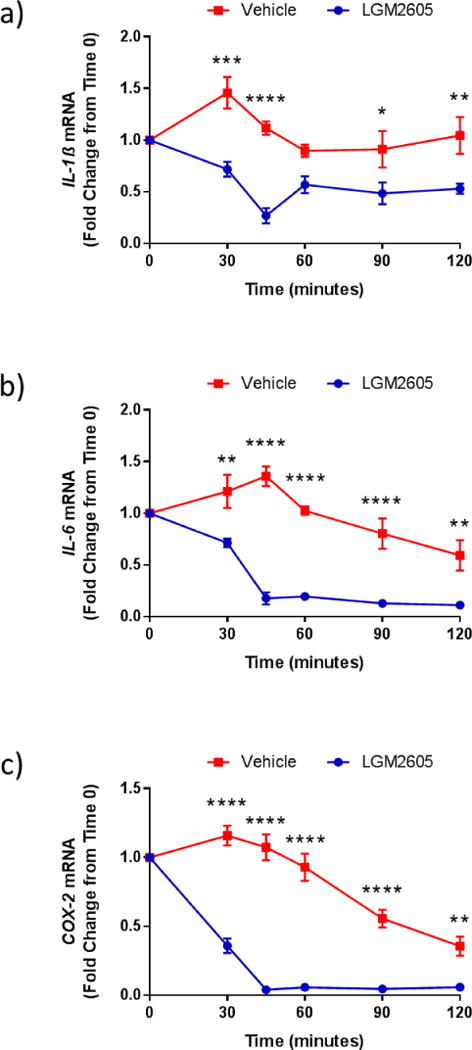
Figure 7. Transcriptomic response of lung tissue to LGM2605.

Effects of LGM2605 (blue line) were compared to vehicle (red line) in a common perfusate independent ventilation configuration. Decreased proinflammatory gene expression was demonstrated in IL-1β (a); IL-6 (b); and COX-2 (c) transcripts as early as 30 minutes after delivery of LGM2605 in the treated lung and subsequently in the bystander lung after a short delay. Levels of target gene mRNA are reported as the mean fold change from baseline (time 0). Statistically significant differences were determined by two-way analysis of variance (ANOVA) followed by Tukey’s multiple comparisons tests (vehicle versus LGM2605) using GraphPad Prism version 6.00 for Windows, GraphPad Software, La Jolla California USA, www.graphpad.com. Results are reported as the mean ± the standard error of the mean (SEM). Asterisks shown in figures indicate statistically significant differences between vehicle and LGM2605 (* = p<0.05, ** = p<0.01, *** = p<0.001 and **** = p<0.0001).
