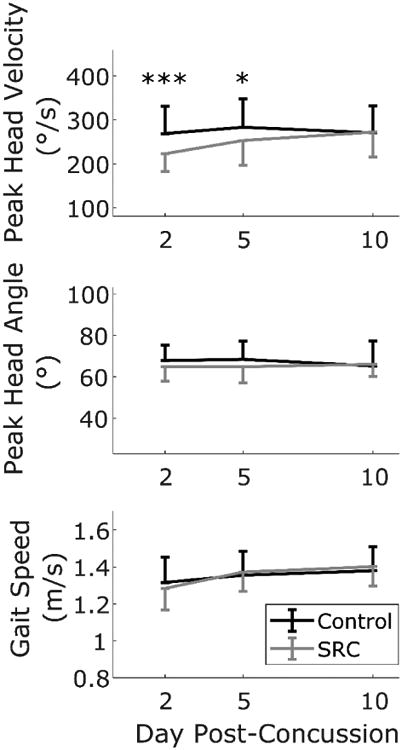
Figure 2.

Mean peak head angular velocity (top), angle (middle), and gait speed (bottom) of athletes during the Walk-HT condition. Athletes with SRC (gray) had slower peak head angular velocities, and increased velocity over time, compared to healthy controls. Error bars indicate standard deviations. For clarity, only one side of the error bar is displayed. Peak head angular velocity was the only outcome significantly different between groups (*** post-hoc independent t-test p< 0.001, * post-hoc independent t-test p = 0.029).
