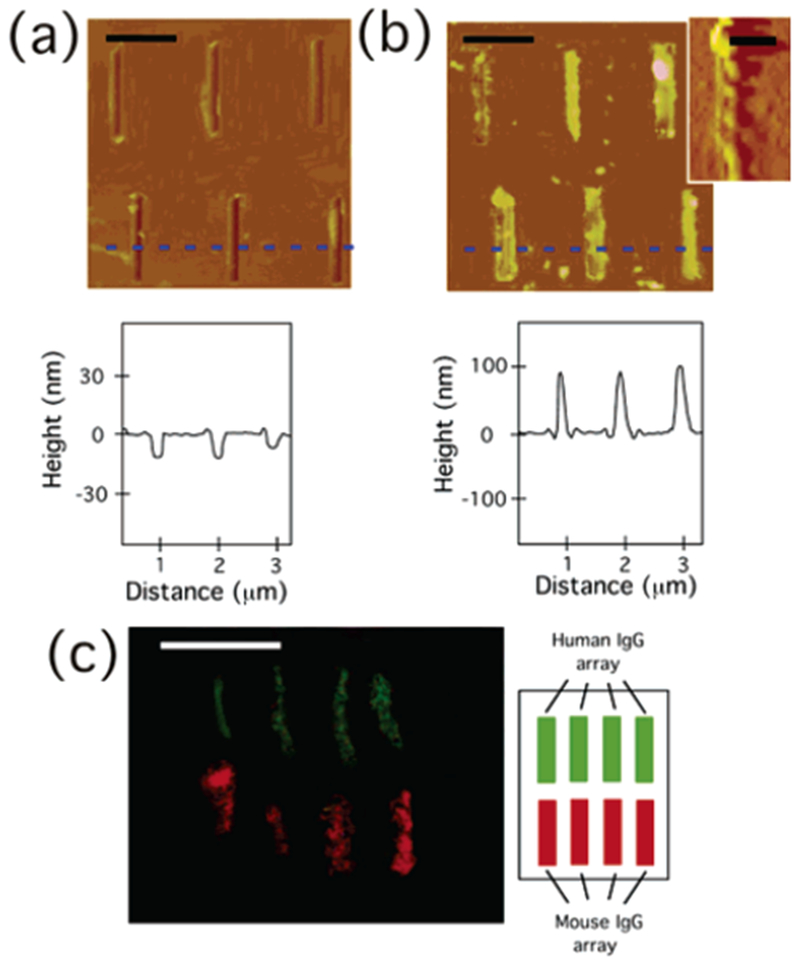
Figure 2.

(a) (Top) AFM image (height mode) of 3 × 2 trenches patterned by AFM tip (as shown in Figure 1b). (Bottom) Section analysis along a blue dotted line in the image, scale bar = 750 nm. (b) (Top) AFM image (height mode) of anti-mouse IgG-coated nanotubes immobilized on 3 × 2 trenches filled with mouse IgG (as shown in Figure 1f). (Bottom) Section analysis along a blue dotted line in the image, scale bar = 750 nm. (Inset): Magnified AFM image (amplitude mode) of the single anti-mouse IgG-coated nanotube, scale bar = 300 nm. (c) (Left) Fluorescence image of anti-mouse IgG nanotubes (red) and anti-human IgG nanotubes (green), attached onto four upper trenches filled with mouse IgG and four bottom trenches filled with human IgG, respectively (as shown in Figure 1f), scale bar = 2 μm. (Right) Locations of human IgG and mouse IgG arrays.
