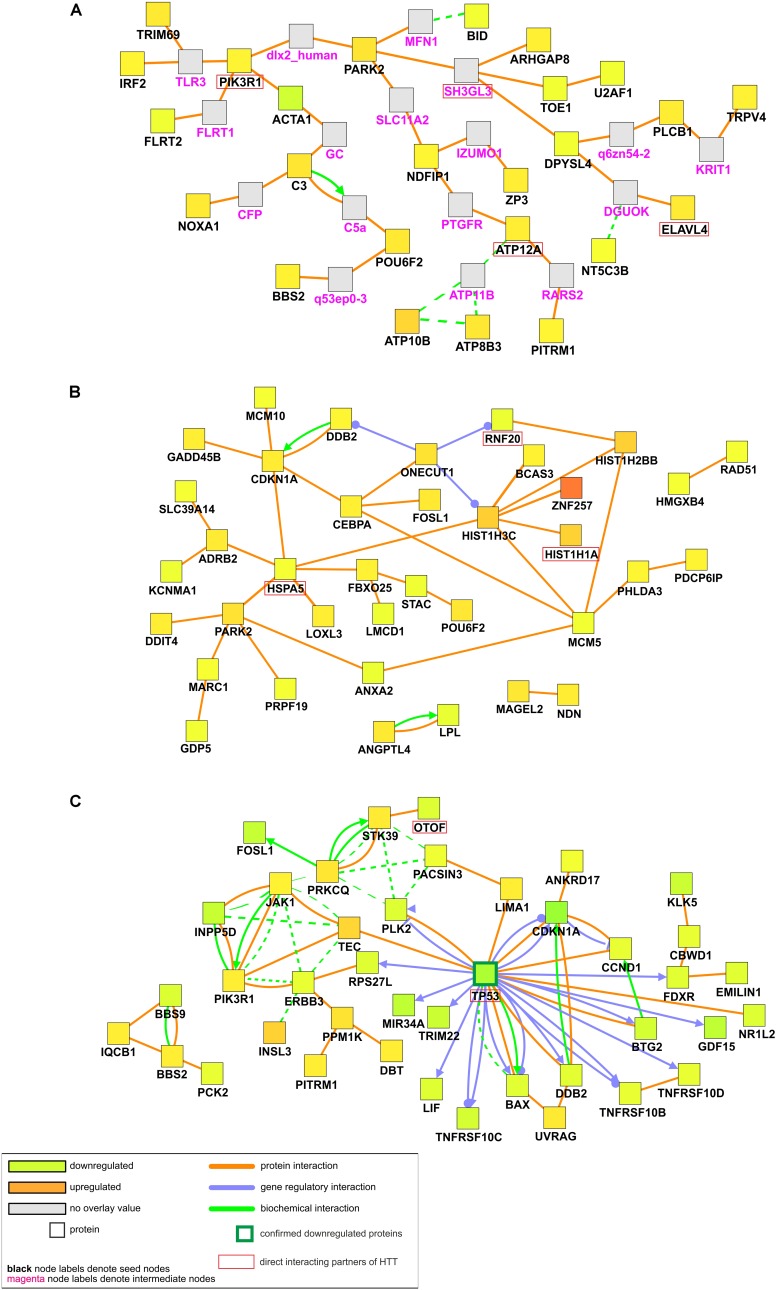
FIGURE 4.
Induced network modules analysis of DE transcripts in HD iPSC lines. CPDB induced network modules aims to connect a list of seed genes via different types of interactions (protein interactions, biochemical interactions, or gene regulatory interactions). Connections are made directly, or via an intermediate node (shown in gray). As considered to be significantly dysregulated, transcripts with adjusted p value of < 0.05 were submitted to the analysis. As genes identifier types, HGNC symbols were chosen. (A) Network plot for significantly dysregulated transcripts in both HD iPSC lines vs. control. (B) Network plot for significantly dysregulated transcripts only in HD71Q iPSC lines. (C) Network plot for significantly dysregulated transcripts only in HD109Q iPSC lines. Proteins confirmed after proteomic analysis were pinpointed by a green border of the certain nodes. Names of direct interacting partners of the HTT protein were highlighted with red border.

