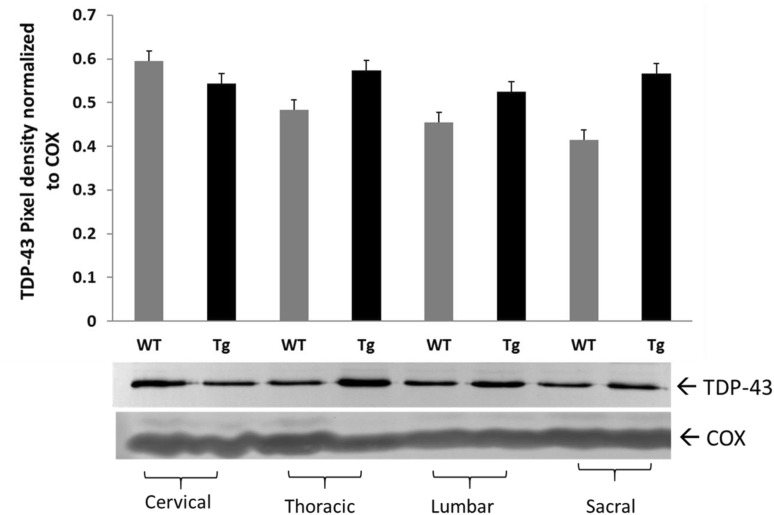
Fig. 2.
TDP-43 protein levels in spinal cord regions of SOD1G93A Tg rat. TDP-43 protein levels in spinal cord regions of WT (n = 6) and Tg (n = 8) animals. Pan anti-TDP-43 Ab was used for Western blot analysis. No statistically significant difference was observed in cervical (P < 0.0663), in thoracic (P < 0.250), in lumbar (P < 0.393), and in sacral (P < 0.157) regions of WT and Tg animals. Data are mean ± SEM

