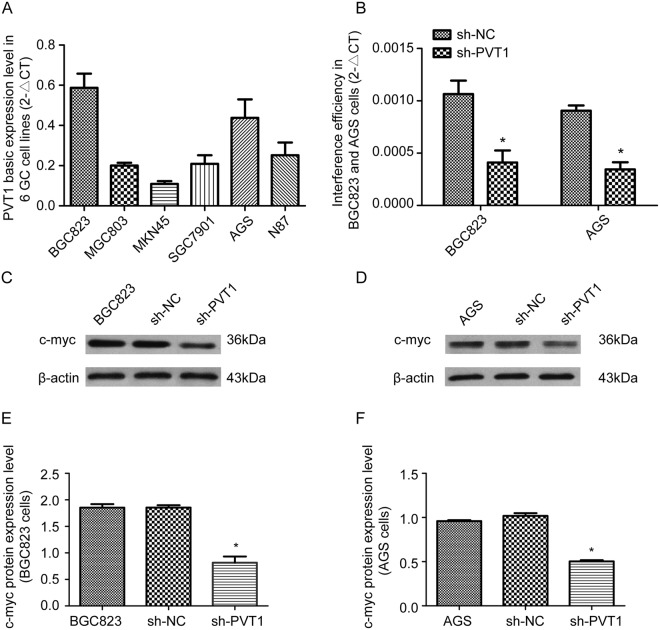
Figure 2.
Decreased c-myc expression in BGC823 and AGS cells after interference with PVT1 expression. (A) Real time-PCR results show the endogenous PVT1 expression levels in the six GC cell lines BGC823, MGC803, MKN45, SGC7901, AGS and N87. (B) RNAi was used to interfere with the expression of PVT1 in BGC823 and AGS cells, and then the efficiencies of PVT1 knockdown were investigated using real time-PCR. (C,D) Detection of c-myc protein expression levels by western blotting in BGC823 and AGS cells after silencing of PVT1. *P < 0.05.

