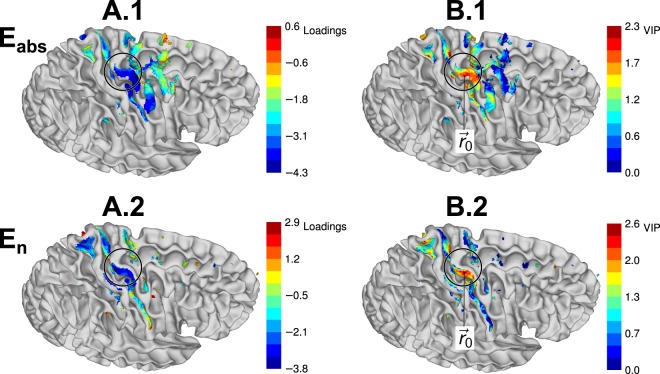
Figure 4.
Important brain regions estimated using PLS regression analysis. (A.1 and 2) Loadings of the first PLS component for the absolute value (A.1) and normal component (A.2) of the EF. (B.1 and 2) VIP, indicating the relative importance of brain regions for predicting the mean normalized MEP from the absolute value (B.1) or the normal component (B.2). indicates the point with the maximum VIP for the normal component. Coloured regions are the cortical regions that contain the highest 2% EFs and that were used as predictors for PLS regression. The surface of the white matter is shown in grey. Circle indicates the inverted omega of the hand knob.

