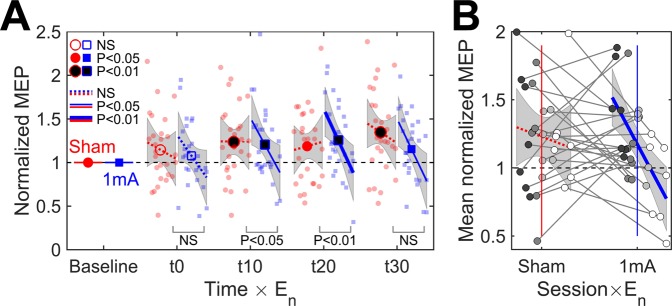
Figure 5.
(A) Effect of the EF normal component and time on normalized MEP for 20 min 1 mA anodal tDCS of the right M1 (N = 27). Lines and shaded areas are the regression lines (range: 0.20–0.60 V/m) and the 95% confidence intervals. Filled markers and solid lines indicate significant differences from the baseline in the mean values and slopes, respectively. Bottom labels indicate the significance of the difference between the slopes of sham and real tDCS at each time point (NS = not significant). (B) Simple linear regression between and grand mean normalized MEP. Disks show the data for individual subjects, different shades of grey indicate the division of subjects into quartiles based on their EFs. The grey line segments indicate the changes between sessions. Coloured vertical lines show the mean values of .

