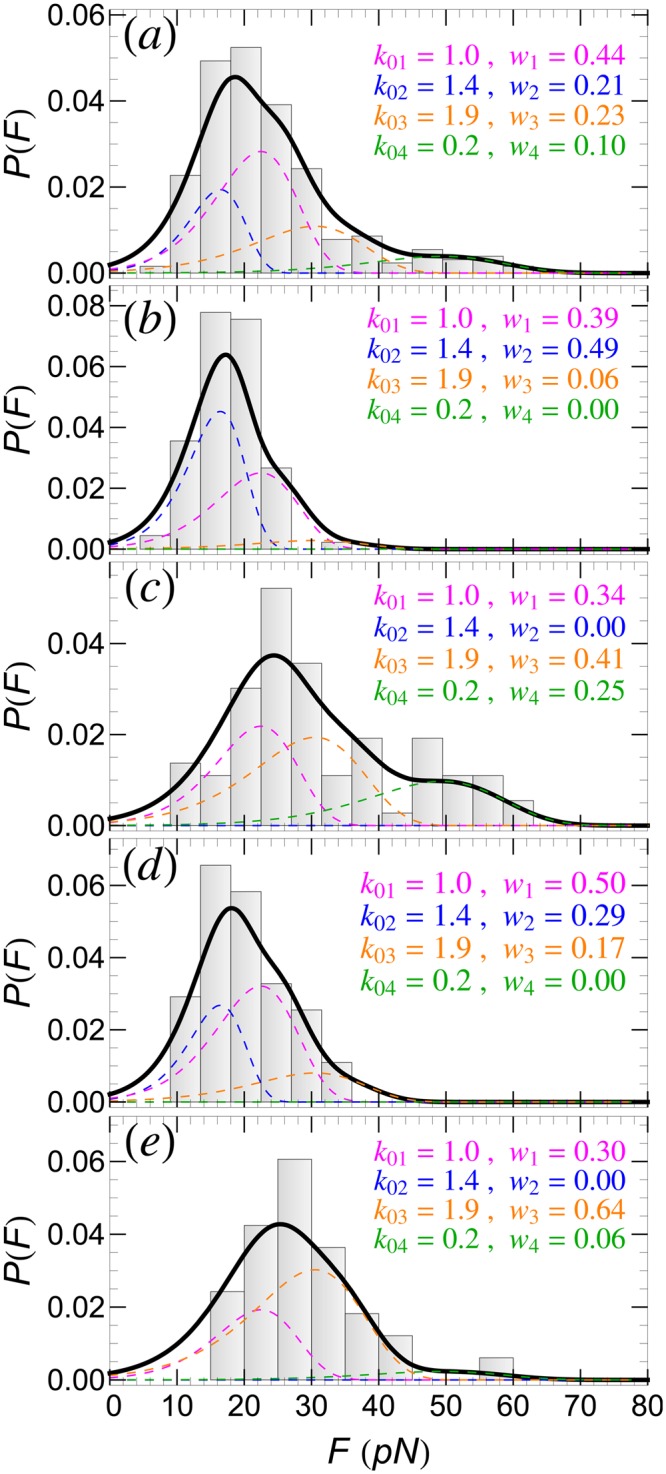
Figure 2.

Detachment force histogram, P(F), of SecA2-11 interacting with POPC bilayer using data from (a) all AFM tips, and (b–e) four individual AFM tips. In each case, P(F) can be fitted well by using four detachment pathways (solid-thick curves). Contributions to P(F) from the n-th (n = 1, ..., 4) detachment pathways are shown as colored dashed curves; the corresponding intrinsic rupture rates, k0n, and weights, wn, are also listed.
