Figure 3.

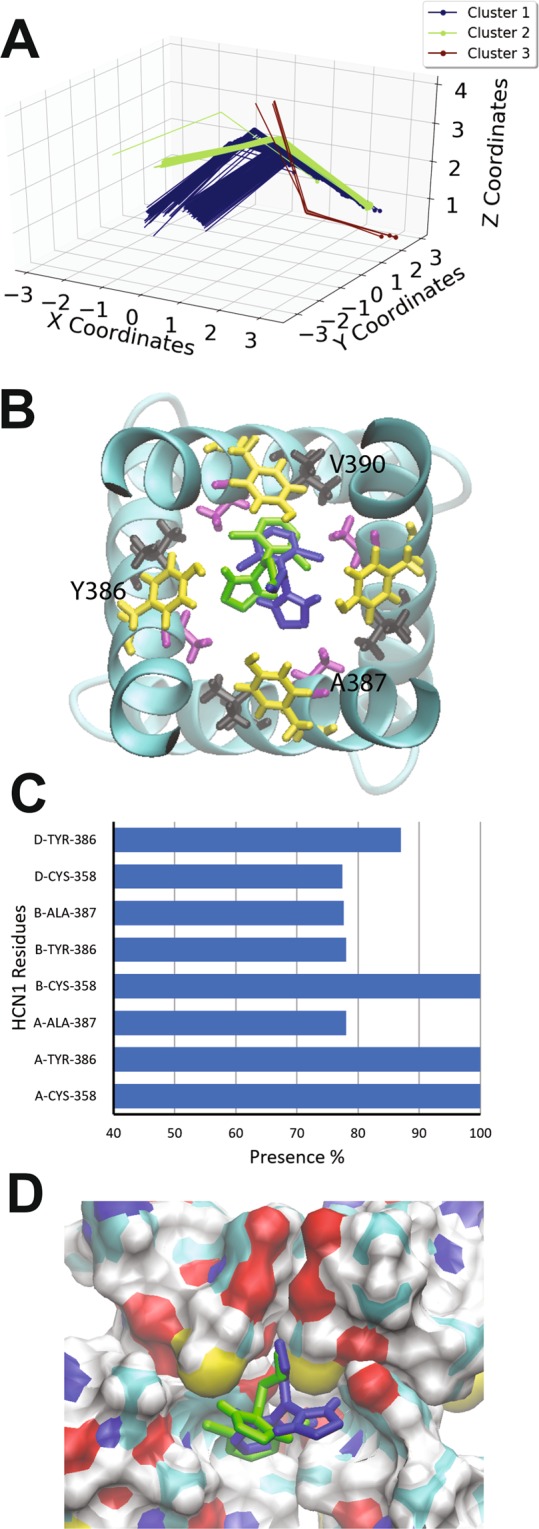
Docking of alinidine to the open HCN1 pore. (A) Clustering analysis of the 500 docking attempts. Docks can be placed into 3 clusters according to our automated algorithm. Cluster 1 (blue), cluster 2 (green) and cluster 3 (red) contained 319, 177 and 4 poses respectively. (B) Top view of the HCN1 pore with representative poses from cluster 1 (blue) and cluster 2 (green) are shown with residues C358 (pink), Y386 (yellow), A387 (purple) and V390 (black) highlighted (C) The frequency of residues within 4 Å of the ligand for each pose was assessed and is indicated as a percentage. (D) A comparison of clonidine poses in cluster 1 (blue) and cluster 2 (green). The ligand fits into a hydrophobic groove lined by residues C358, Y386, and A387.
