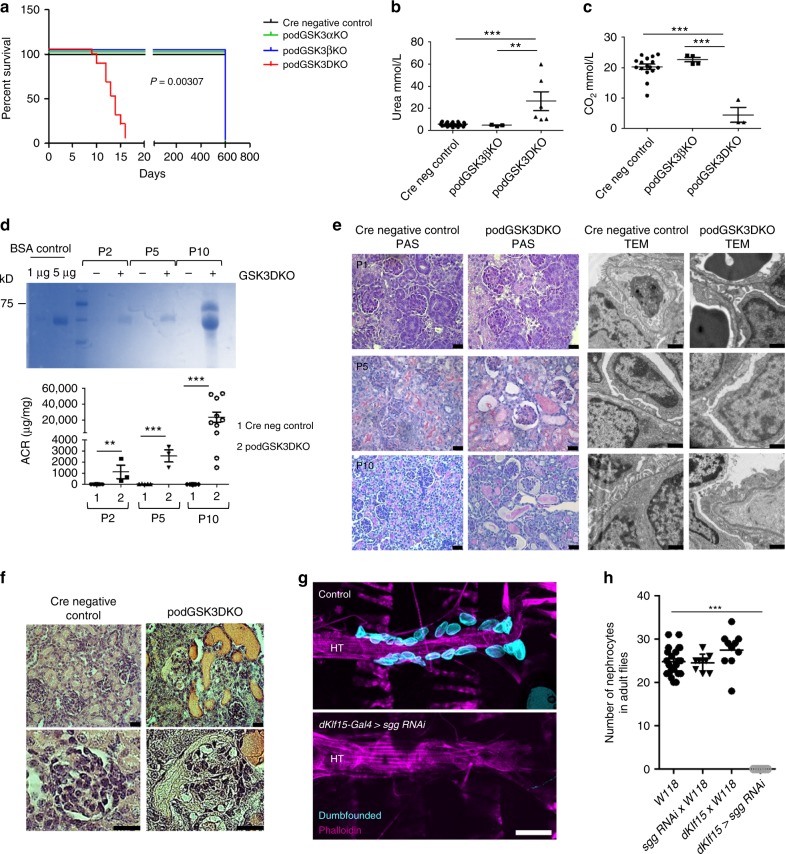
Fig. 1.
Developmental loss of podocyte/nephrocyte GSK3 is catastrophic. a Kaplan–Meier survival plot. Log-rank (Mantel-Cox test) p = 0.00307 (Cre negative controls n = 3; podGSK3αKO n = 3; podGSK3βKO n = 3; podGSK3DKO n = 19 mice). b podGSK3DKO mice are in renal failure with elevated urea levels at day 11 (one-way ANOVA, Tukey’s post hoc test **p < 0.01; ***p < 0.001 Cre negative controls n = 25; podGSK3βKO n = 3; podGSK3DKO n = 6 mice). c podGSK3DKO mice are acidotic at day 11 with significantly lower bicarbonate levels (one-way ANOVA, Tukey’s post hoc test ***p < 0.001 Cre negative controls n = 16; podGSK3βKO n = 4; podGSK3 DKO n = 3 mice). d Rapid progression of kidney disease in the first 11 days of life in podGSK3DKO mice. Top: a Coomassie gel showing progression of albuminuria in an illustrative knockout and control mouse (2 μl of urine loaded in each lane). See also Supplementary Fig. 1 g. Bottom: graph showing the albumin:creatinine ratio (ACR) in a population of podGSK3DKO and control mice (t test **p < 0.01; ***p < 0.001 Cre negative controls P2 n = 8; podGSK3DKO P2 n = 3; Cre negative controls P5 n = 5; podGSK3DKO P5 n = 3; Cre negative control P10 n = 10; podGSK3DKO P10 n = 10 mice). e PAS (scale bar 25 μm) and transmission electron microscopy (scale bar = 1 μm) of podGSK3DKO and control mice at P1, P5 and P10. f H & E at P10 of podGSK3DKO and control mouse shows tubular protein casts and vacuolated glomeruli Scale bar = 25 μm. g Specific shaggy knockdown and control nephrocytes immunostained with dumbfounded (cyan). Scale bar = 100 µm. HT heart tube. h Nephrocyte number n = 6–10 flies per genotype; ANOVA, ***p < 0.001 for the effect of genotype. Data are presented as the mean + /-SEM

