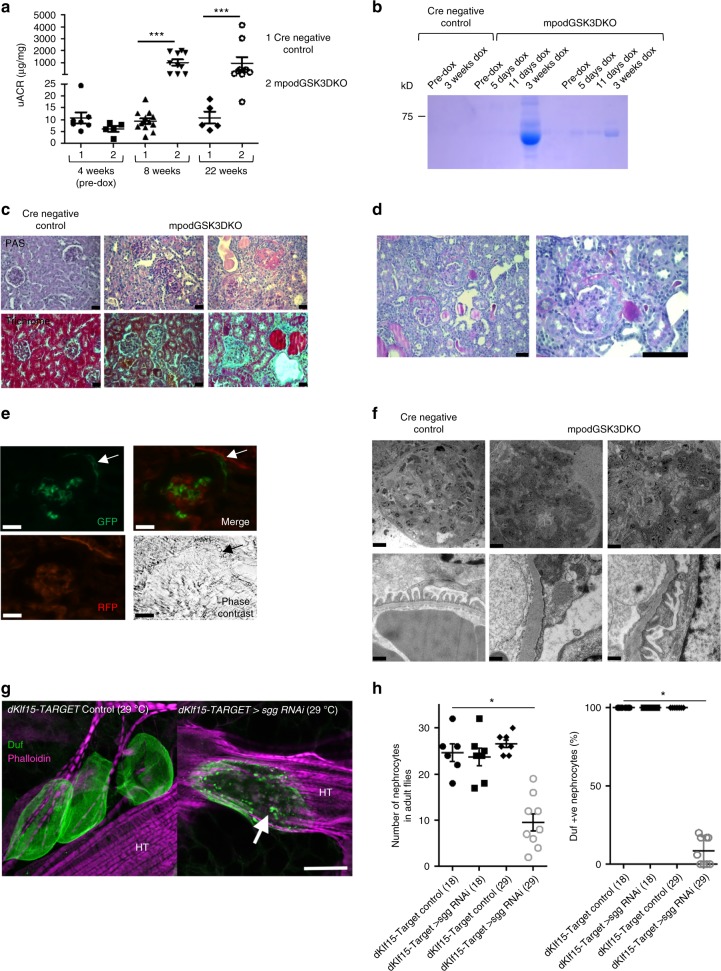
Fig. 2.
Mature loss of podocyte/nephrocyte GSK3 is detrimental. a Significant albuminuria in mpodGSK3DKO mice. Population characteristics shown. Mann-Whitney Analysis of groups ***p < 0.001 (n = 9–10). b Representative Coomassie staining of urine from mice. 2 μl urine loaded. c Spectrum of renal involvement in model. PAS and trichrome staining. Left panels = control Middle panel = least albuminuric mouse. Right = most albuminuric mouse with global glomerulosclerosis. This mouse was in renal failure with severe hypertension. Scale bar = 25 μm. See also Supplementary Fig. 3. d Representative picture of glomerular crescents in mpodGSK3DKO mice. Scale bar = 50 μm. e Lineage tagging of mpodGSK3DKO podocytes by crossing with mT/mG reporter shows extracapillary cells are originating from podocytes. GFP and merge show green fluorescent protein (GFP) tagged podocytes in Bowman’s space (arrowed). Scale bar = 25 μm. f Glomerular filtration barrier TEM from two 22-week mpodGSK3DKO mice. Shows podocyte foot process retraction, mesangial hypercellularity and glomerular basement membrane thickening. Scale bar top panel = 10 μm; bottom panel = 500 nm. g Confocal micrographs of adult Drosophila heart stained with phalloidin (to visualise the heart tube [HT]) and antibodies to the nephrocyte marker protein Duf. Adults were reared at 18 °C until eclosure, then transferred to 29 °C. This temperature shift permits the expression of RNAi to shaggy specifically in nephrocytes at the higher but not the lower temperature. At 29 °C, nephrocytes in the sgg RNAi flies developed an enlarged morphology and abnormal foci of Duf immunoreactive staining across the cell surface (arrow). Controls at the same temperature exhibit a wild-type morphology (three nephrocytes are shown). Scale bar = 50 μm. h Graphs show number of nephrocytes in adult flies and percentage that were immunopositive for anti-Duf antisera. ANOVA *p < 0.05; n = 6–8 flies for each genotype at each temperature. Data are presented as the mean ± SEM

