Fig. 3.
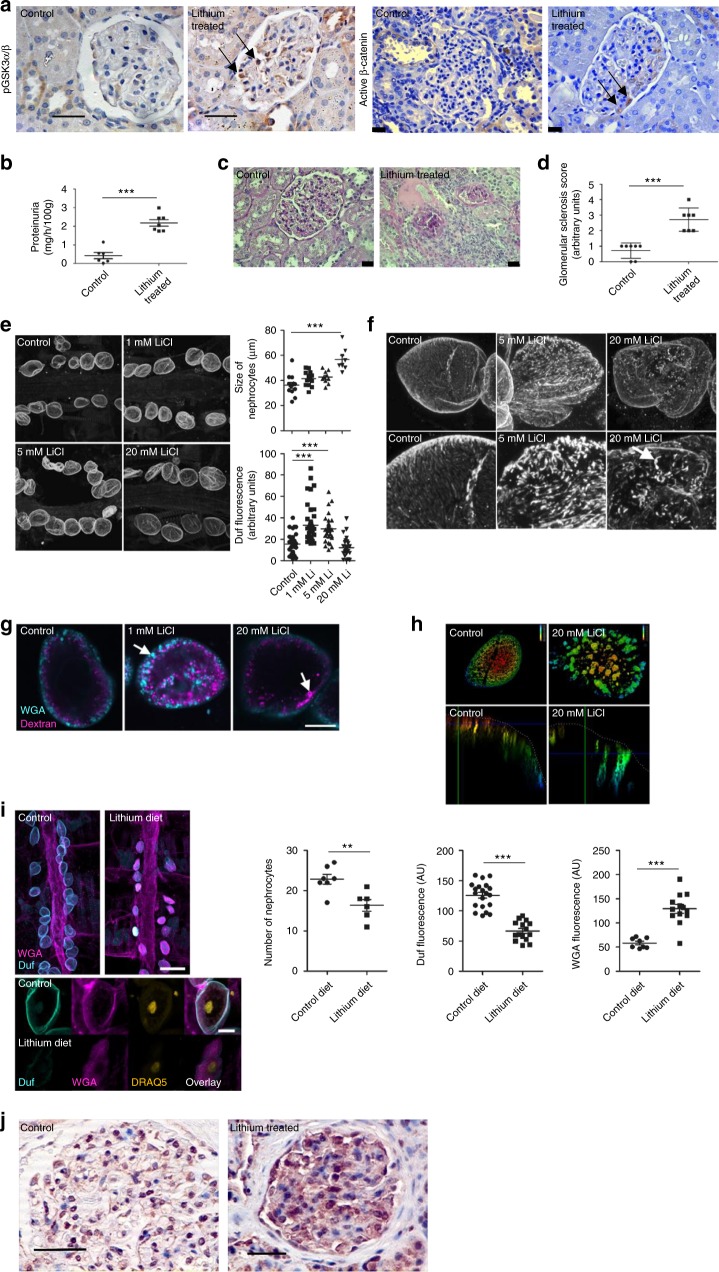
Pharmacological suppression of podocyte/nephrocyte GSK3. a Wistar rats fed lithium for 6-months caused inhibitory phosphorylation of GSK3α/β (left panel) and nuclear activation of β-catenin within their podocytes (right panel) (arrowed). Scale bar = 25 μm. b Lithium-treated rats developed significant proteinuria. t test ***p < 0.001, control n = 6; lithium treated n = 7. c, d Lithium-treated rats had evidence of glomerulosclerosis. Representative glomerular pictures shown, scale bar = 25 μm (c) together with blinded scoring of glomerulosclerosis index (d) in the 6-month treated Lithium and control group (n = 6–7). Unpaired two-tailed t-test*** p < 0.001. e At 24 h there is a dose response increase in nephrocyte size with increased Duf expression. ANOVA, ***p < 0.001, n = 6 individual flies per dose. f Altered cellular location of Dumbfounded in the nephrocyte after 24 h in a dose-dependent manner. Z-projected confocal stacks of controls show short linear arrays of Duf staining, presumed to be openings of individual slit diaphragms (arrowed). Cells treated with LiCl show disrupted Duf staining. g LiCl treatment affects endocytic Dextran uptake of dextran after 48 h. View through midpoint of cell. 1 mM demonstrates increased dextran signal uptake. At 20 mM severe disruption of dextran uptake. Cyan = dextran. Magenta = Wheat Germ Agglutinin (WGA). Scale bar = 10 μm. h The depth coloured images show nephrocytes stained with WGA after incubation for 48 h with or without 20 mM lithium. The uppermost region of the cell is red, the lower most is blue. In the control WGA (green) is located at the cell surface in shallow lacunae, whereas in the lithium treated cell the WGA associates with wider, deeper lacunae. Lower panels show a transection through the cell with a lacuna highlighted by an arrow. i Prolonged exposure of nephrocytes to lithium causes nephrocyte loss, reduced Duf expression and increased WGA nephrocyte accumulation (t test ***p < 0.001; n = 6–7 flies after 1-week exposure to 5 mM of lithium) DRAQ 5 was used to visualise nuclei. Scale bar top panel = 100 μm; bottom panel = 10 μm. j Immunohistochemistry showing increased inhibitory phosphorylation of GSK3αβ in the glomerulus from a patient on long-term lithium therapy when compared with a control biopsy. Scale bar = 50 μm. Data are presented as the mean ± SEM

