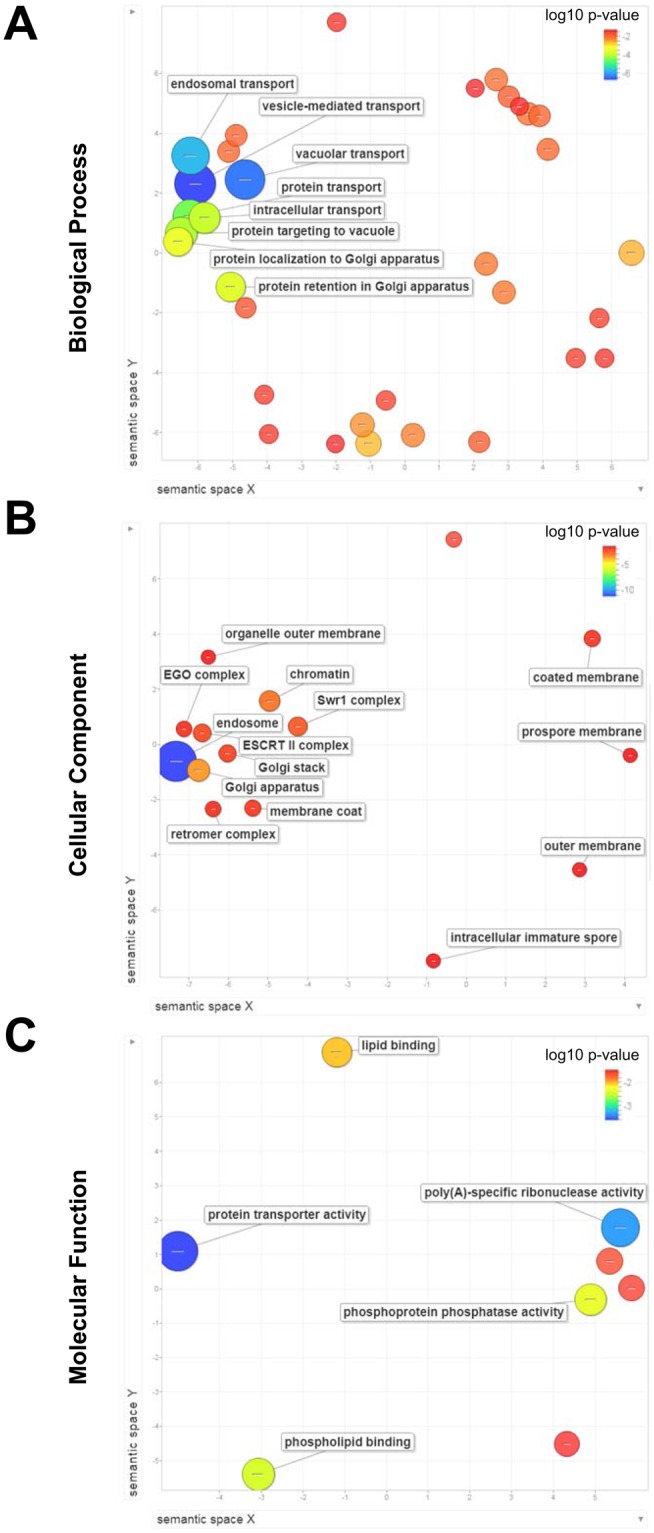
Figure 4.

Gene Ontology (GO) analysis of genes conferring resistance to hypoculoside. Enrichment of GO terms among the top 336 genes conferring resistance (logFC value < −0.5 and P-value < 0.05) to hypoculoside was determined by using DAVID in combination with REVIGO. The three plots show the enrichment of GO terms in the following categories: (A) Biological Process, (B) Cellular Component and (C) Molecular Function. For each category, the semantic similarities between the non-redundant GO terms are represented as scatterplots in 2-dimensional space. Related GO terms cluster together in the plot. The p-value for the false discovery rates of each GO term is represented by the colour of the corresponding circle. The GO term frequency in the GO database is represented by the size of the corresponding circle.
