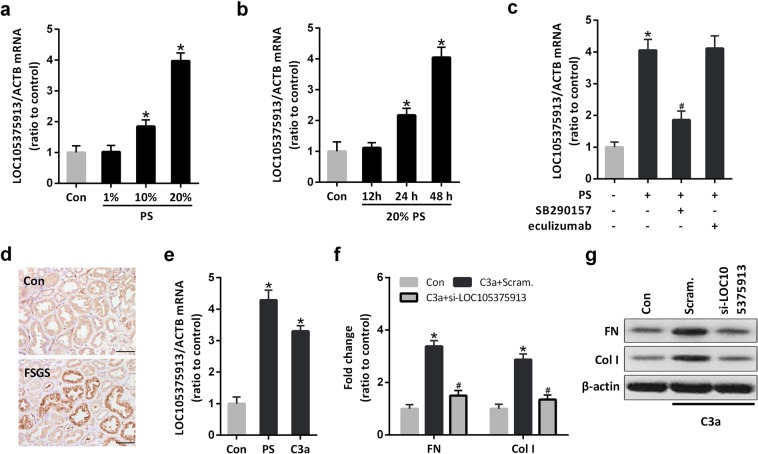
Figure 2.
Effect of C3a on the expression of LOC105375913 in tubular cells. (a) RT-PCR analysis of LOC105375913 in HK-2 cells treated with different concentrations of patients’ serum (PS) for 48 h (n = 5); (b) RT-PCR analysis of LOC105375913 in HK-2 cells treated with 20% PS for different times (n = 5); (c) RT-PCR analysis of LOC105375913 in HK-2 cells treated with 20% PS, eculizumab and SB290157 for 48 h (n = 5); (d) IHC analysis of C3a in FSGS patients and normal controls (n = 5); (e) RT-PCR analysis of LOC105375913 in HK-2 cells treated with 20% PS and C3a for 48 h (n = 5); (f) RT-PCR analysis of FN and Col I in HK-2 cells treated with C3a and si-LOC105375913 (n = 5); (g) Western blot analysis of FN and Col I in HK-2 cells treated with C3a and si-LOC105375913 (n = 3). Bar = 20 μm. For statistical analysis, one-way ANOVA with Tukey’s post hoc test was used for (a–c, e and f). *P < 0.05 compared with control. #P < 0.05 compared with PS or C3a-treated cells.

