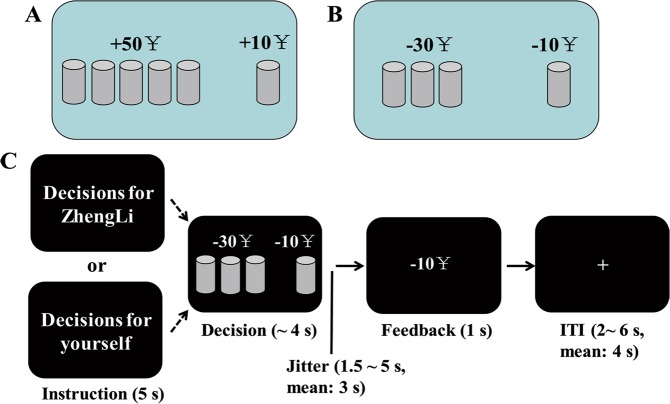
Figure 1.
Experimental task and procedure. (A) An example of gain domain. The risky option leading to a probability of 20% of a ¥50 gain or not gaining anything is displayed on the left side of the screen. The sure option is displayed on the right side of the screen, leading to a sure gain of ¥10. (B) An example of loss domain. The risky option leading to a probability of 33% of a ¥30 loss or losing nothing is displayed on the left side of the screen. The sure option is displayed on the right side of the screen, leading to a sure loss of ¥10. (C) Timeline of each trial. Note that the instruction phase is presented only during the first trial in each block.

