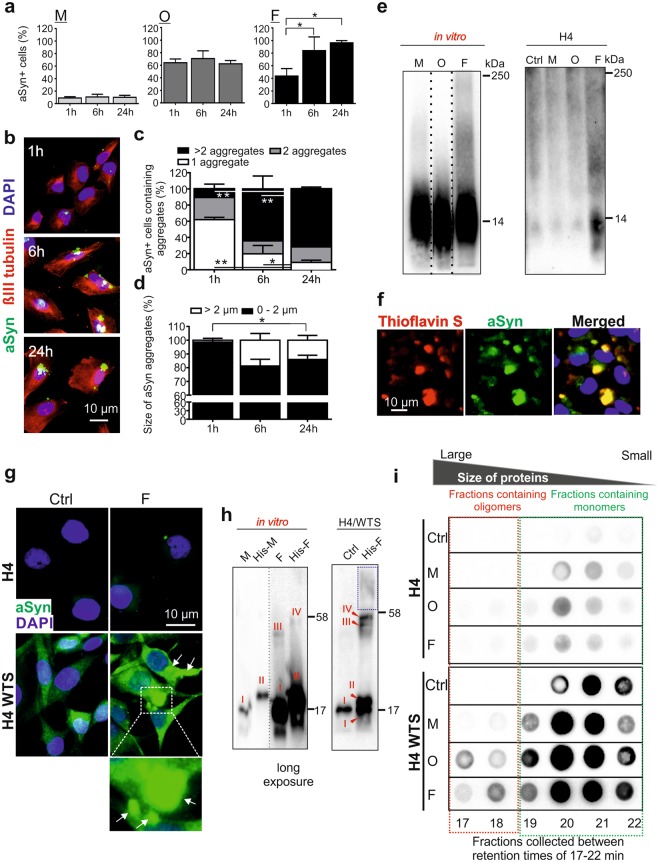
Figure 2.
Stability and seeding effect of extracellular aggregated aSyn. (a) H4 cells were exposed to monomers (M, 2.5 µM), oligomers (O, 2.5 µM), and fibrils (F, 0.1 µM) for 1, 6, and 24 h, respectively. The proportion of aSyn+ cells were analyzed by ICC (n = 3, One-way ANOVA with Tukey’s multiple comparisons test). (b) Example images of fibril-exposed cells. (c,d) Percentage of aSyn+ cells carrying different numbers (1, 2, or >2, (c)) and different sizes of aSyn aggregates (diameter 0–2 µm or <2 µm, (d)) (n = 3, Two-way ANOVA with Tukey’s multiple comparisons test). (e) Blue native PAGE of aSyn species (in vitro, left) and cell lysates from H4 cells exposed to aSyn species (right). Blots within one black frame are derived from the same membrane. Lanes from different parts of the same membrane are separated by dashed lines. As the Syn1-antibody produced a stronger immunosignal for native monomers in vitro, different exposure times were used for aSyn species in vitro (left panel), allowing a clear comparison of the proportion of high molecular weight complexes in different species. (f) Overlap of fluorescent signals of extracellular aSyn (green) and Thioflavin S (red) in fibril-exposed H4 cells. (g) ICC of untreated H4 cells and H4/WTS cells (Ctrl), and cells treated with 0.1 µM fibrils for 1 h. Fibril-induced aSyn aggregation in H4/WTS cells is highlighted either by an enlarged view or by arrows in the ICC images. (h) SDS-PAGE of unlabeled aSyn monomers (M), fibrils (F), as well as histidine-tagged monomers (His-M) and fibrils (His-F). The aSyn species in vitro (left) and in H4/WTS (Ctrl or exposed to His-F for 6 h, right) can be recognized according to molecular weights (I: M, II: His-M, III: an oligomeric species of unlabeled aSyn, and IV: the corresponding oligomeric species of His-aSyn). To visualize species III and IV, a long exposure time was used. Blots within one black frame are derived from the same membrane. The lanes detected with different exposure times are separated by a dashed line. (i) SEC and dot blot analysis of cytosolic soluble proteins from H4 and H4/WTS cells exposed to aSyn species for 6 h. Signals within one black box (retention times: 17–22 min) were derived from the same dot blot membrane. Red and green frames highlight oligomer- and monomer- enriched fractions, respectively.

