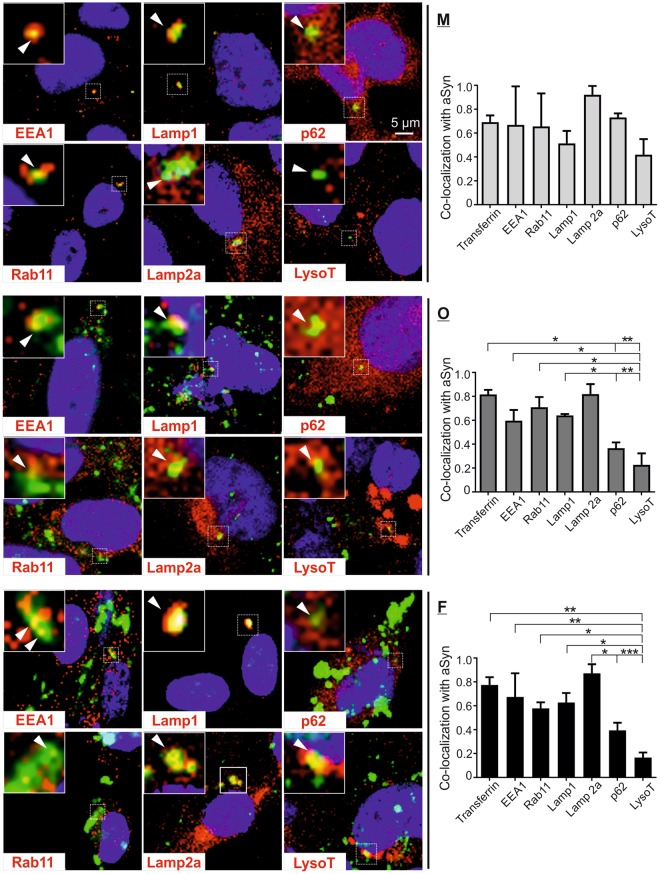
Figure 4.
Co-localization of internalized aSyn species with markers of endosomal/lysosomal pathway. H4 cells were exposed to monomeric (M), oligomeric (O), and fibrillar (F) aSyn. Co-localization of exogenous aSyn (green) with markers of endosomal/lysosomal pathway (red), was analyzed by ICC and confocal microscopy. Analyzed markers included: EEA1 for early endosomes, Rab11 for recycling endosomes, Lamp1/Lamp2a for late endosomes and lysosomal membrane protein; p62 for autophagosomes and lysosomes, and LysoT for lysosomes. A selected region in each image is marked by a dashed frame and its enlarged view is shown at the top left corner of each image. Co-localization of aSyn and endosomal/lysosomal makers (yellow) in selected regions is highlighted by arrowheads and confirmed by the profile intensity plots (Supplementary Fig. S6). Quantification of the degree of co-localization between exogenous aSyn and endosomal/lysosomal markers as well as transferrin (right) demonstrates a generally lower co-localization degree of aggregated aSyn with p62 and LysoT as compared to the co-localization of aSyn with other markers (n = 3, One-way ANOVA with Sidak’s multiple comparisons test).

