Figure 6.
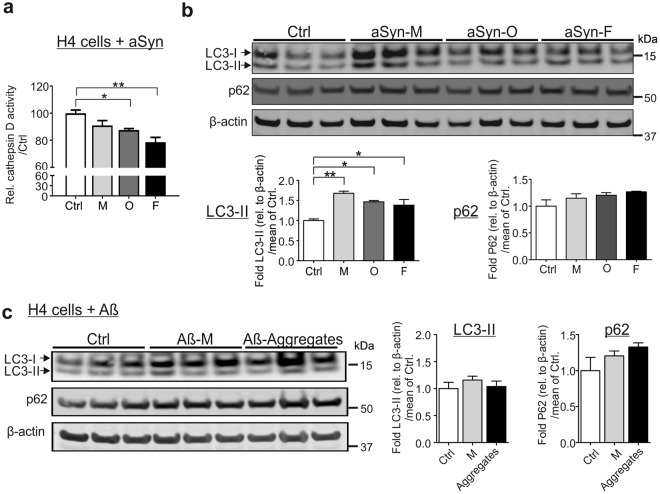
aSyn-mediated impairment in lysosomal activity and autophagosome turnover. (a,b) H4 cells were either untreated (Ctrl) or exposed to monomeric (M), oligomeric (O), and fibrillar (F) aSyn. (a) Lysosomal cathepsin D activity decreases significantly in oligomer- or fibril-exposed cells. (b) WB analysis of ALP markers LC3-II and p62 reveals a significant increase in LC3-II levels in aSyn-exposed cells and p62 up-regulation without reaching statistical significance. (c) H4 cells were either untreated (Ctrl), exposed to 1 µM Aβ monomers (Aβ-M), or Aβ aggregates. LC3-II levels do not change, whereas an up-regulation of p62 is measured without reaching statistical significance. Values are normalized to β-actin. WB bands for LC3-I/II, p62, and β-actin are derived from the same blot (quantification in (a,b), n = 3 and in (c), n = 4, One-way ANOVA with Tukey’s multiple comparisons tests).

