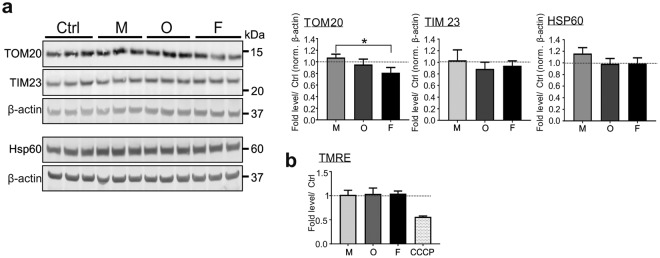
Figure 8.
Impact of extracellular application of aSyn on mitochondria. Monomeric (M), oligomeric (O), or fibrillar (F) aSyn was applied to H4 cells. (a) WB analysis of the markers of mitochondrial mass (TOM20, TIM23, and HSP60). The bands for TOM20, TIM23, and β-actin (upper panel), as well as the bands for HSP60 and β-actin (lower panel) are derived from the same blots. Mitochondrial markers are normalized to β-actin of the identical blot. (b) Flow cytometric analysis of mitochondrial membrane potential-sensitive TMRE staining. Application of aSyn to cells does not change the mass of mitochondria and mitochondrial membrane potential, regardless of its aggregation state, when compared to untreated cells (Ctrl) (quantification in (a,b), n = 3, One-way ANOVA with Tukey’s multiple comparisons tests).

