Figure 5.
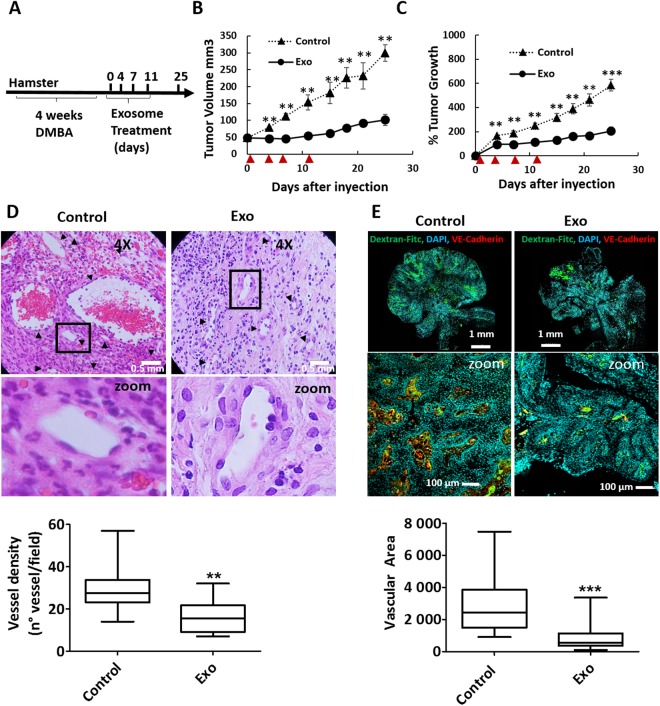
Tumor growth and angiogenesis is significantly reduced by exosome treatment. (A) Scheme of experimental design. Tumors were induced with four weeks of DMBA treatment and four injections of exosomes were administered every 3–4 days (B,C) Tumor growth in mm3 tumor volume and relative tumor growth.  indicates days of exosome treatment. Control tumors ar e shown as triangles and exosome treated tumors as circles. N = 9 (control), N = 8 (Exo). (D) Histological sections of tumors at day 25 (end-point) with Hematoxylin and eosin stain (H&E). Quantification of vessel density based on H&E sections is shown below. ▲ indicates vessels. (E) Dextran-Fitc (green), VE Cadherin (red) and Hoechst (blue) stained histological sections of tumors at day 25 (end-point). Upper panel: complete tumors, lower panel: zoom of selected tumor area. VE-Cadherin is only shown for zoom (lower panel). Graph shows quantification of vascular area based on dextran stain. Analysis: unpaired t-test. Bar graphs show average values, error bars: SEM.

