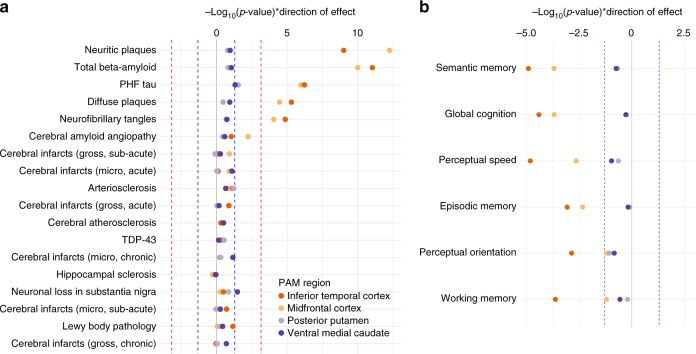
Fig. 3.
Associations of PAM phenotypes with neuropathology and cognitive decline. a −Log10(p-values), weighted by direction of effect, indicating the strength of evidence for association of each brain-wide neuropathology measure with PAM. b –Log10(p-values), weighted by direction of effect, indicating the strength of evidence for association of each measure of longitudinal cognitive decline with PAM. The red dotted lines in panel a indicate corrected statistical significance thresholds, and the blue dotted lines in both panels indicate uncorrected thresholds of p = 0.05. All p-values are two-sided and calculated from parameter estimates of iterative re-weighted least-squares regression. Model covariates included age at death, postmortem interval, APOE ε4 status, and top three EIGENSTRAT principal components (nMF = 225, nIT = 219, nPPUT = 198, nVM = 218)

