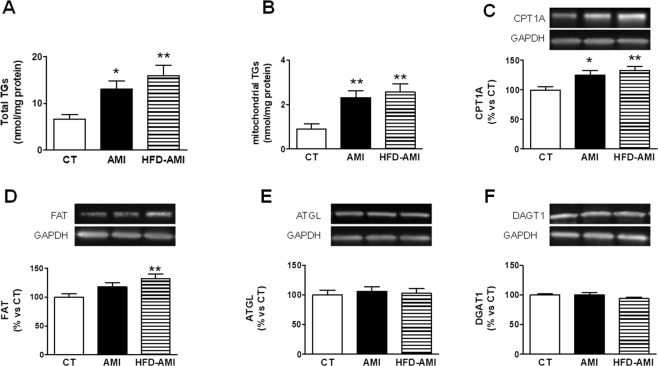
Figure 2.
Impact of MI on total and mitochondrial triglycerides and protein levels in heart from non-obese and obese rats. Cardiac levels of (A) total triglycerides (TGs), (B) mitochondrial triglycerides. Protein expression of (C) carnitine palmitoyl transferase 1 (CPT1A), (D) Fatty acid translocase (FAT), (E) adipose triglyceride lipase (ATGL) and (F) diacylglycerol transferase 1 (DAGT1) in control rats (CT), or rats submitted to MI fed a standard (AMI) or a high fat diet (HFD-AMI). Bar graphs represent the mean ± SEM. of 8–10 animals normalized to glyceraldehyde-3-phosphate dehydrogenase (GAPDH). *P < 0.05; **P < 0.01; ***P < 0.001 vs control group. † < 0.05; ††P < 0.01; †††P < 0.001 vs AMI group.

