Fig. 1.
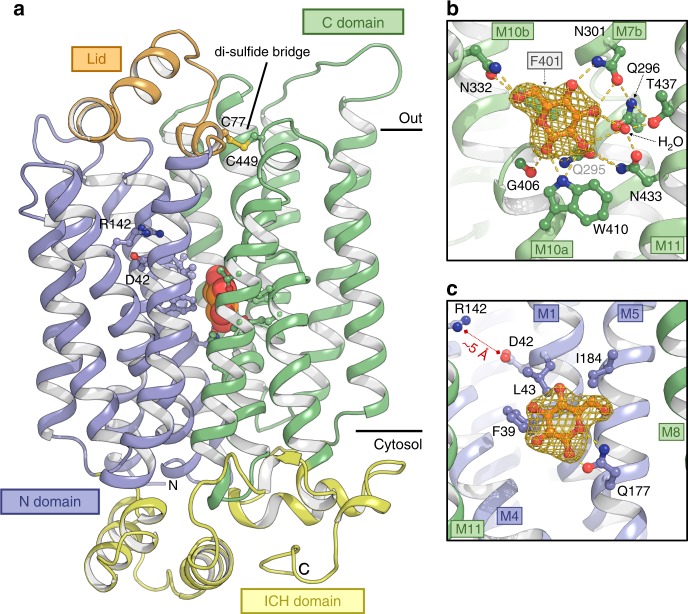
Structure of the high affinity Sugar Transport Protein STP10. a The structure represents an outward facing occluded state of the sugar transporter in complex with glucose. Glucose (shown as spheres) is buried in the membrane at the interface between the N domain (blue) and C domain (green). Selected residues are shown as sticks. Black bars depict the approximate location of the membrane. b The glucose binding site towards the C domain. Yellow dashes indicate hydrogen bonds (2.6–3.6 Å distances) to glucose. The omit mFobs-DFcalc density for glucose is contoured in gold (5σ). c Same as panel b for the glucose binding site towards the N domain

