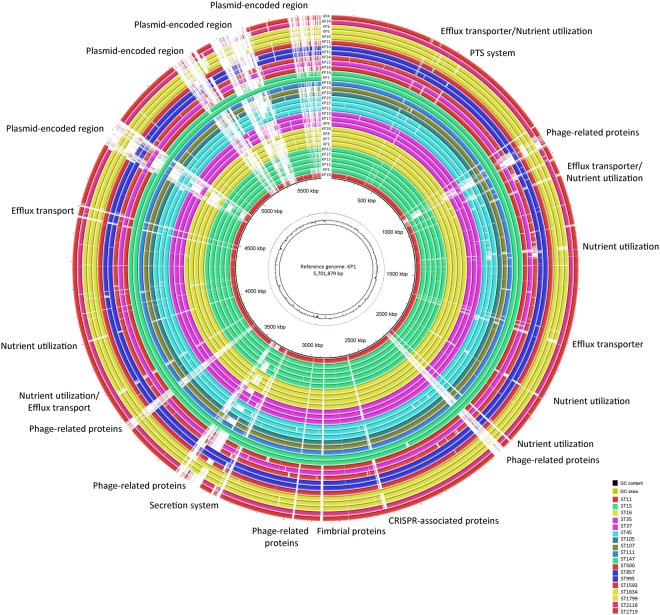
Figure 5.
Circular genomic map and genome comparison of 32 K. pneumoniae genomes. The circle is divided into arcs representing the genomes as labeled. The black histogram represents the GC content and purple-green histogram represents the GC deviation. The isolates are colored according to their STs. The function of genes which were part of major deletion events are labelled at the edge of the rings. KP1 was used as a reference genome.

