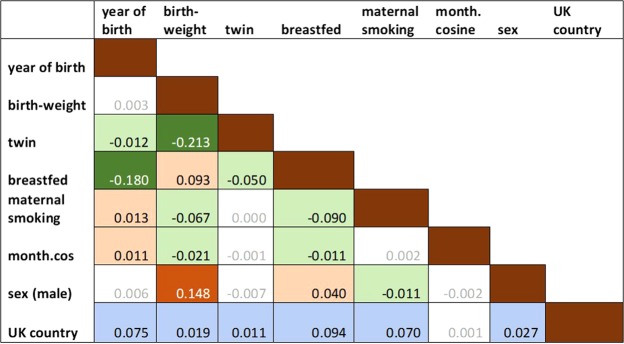
Figure 1.
Associations between predictor variables. For associations between categorical variables, Cremer’s V is presented. Associations between continuous variables are shown as Pearson R. Associations between binary categorical and continuous variables are shown as Spearman rho. Associations between multi-category variable UK Country and continuous variables are shown as the ANOVA adjusted R. Colour and sign show the direction of the association between two binary variables, between two continuous variables or between binary and continuous variables (orange positive, green negative). Grey font indicates non-significant associations (p > 0.001).

