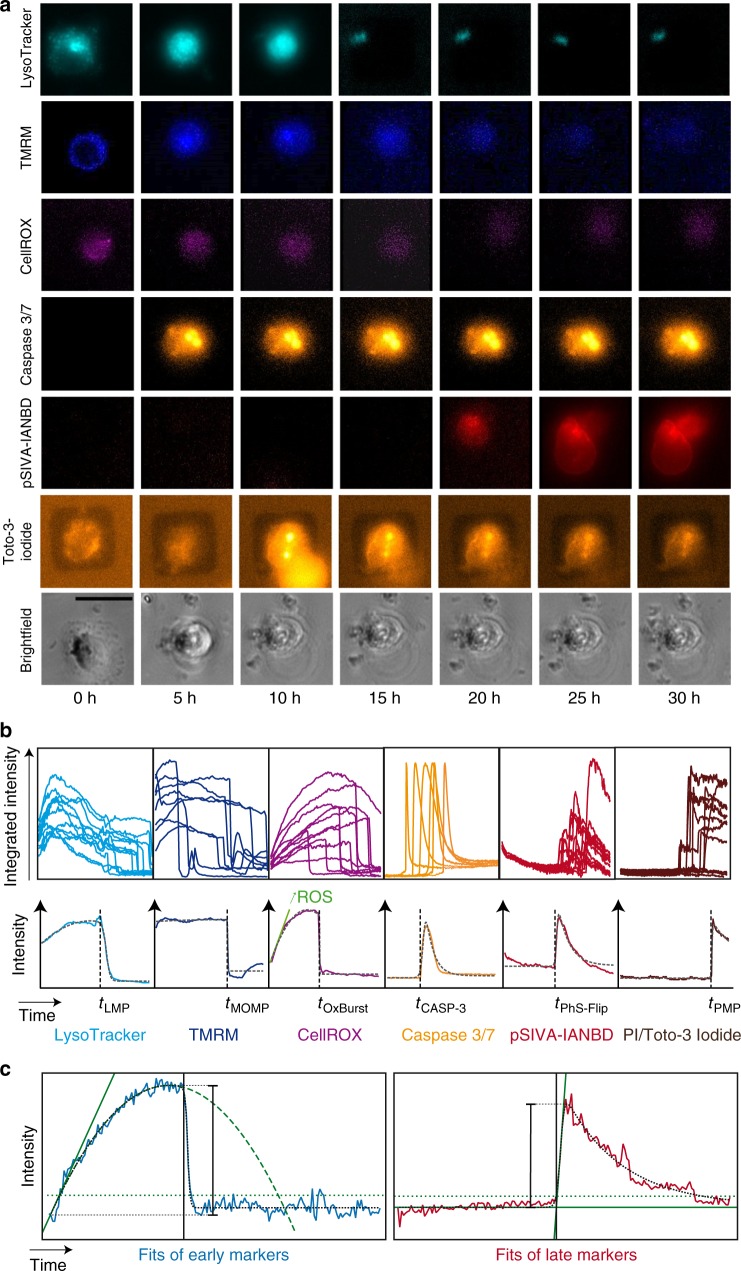
Fig. 2.
Image series and time traces of fluorescence markers. a Representative time-lapse images of cells that were exposed to 58 nm 100 µg mL−1 amino-modified polystyrene nanoparticles (PS-NH2 nanoparticles), imaged over 30 h, and stained for lysosomes (LysoTracker, cyan), functional mitochondria (tetramethylrhodamine methyl ester (TMRM), blue), reactive oxygen species (ROS) and oxidative burst (OxBurst; CellROX, purple), activated caspase 3/7 (Caspase 3/7, orange), and flipped phosphatidylserine (pSIVA-IANBD, red). Contrast was adjusted for better visibility. Scale bar: 30 µm. b Representative time traces of each marker in single cells: lysosomes (LysoTracker), MOMP (TMRM), OxBurst (CellROX), caspase 3/7 activation (Caspase 3/7 marker), PhS-Flip (pSIVA-IANBD), and staining of nuclei by propidium iodide (PI) or Toto-3 Iodide. c Exemplary single-cell traces typical for early markers (blue solid line) and late markers (red solid line) with the corresponding noise levels (dotted horizontal green lines). For early markers, the solid green line shows the initial slope, and the vertical black line depicts the breakdown time, which is the time from which on the trace deviates from the parabolic behavior (dashed green line) by more than a threshold. For late markers, the marker onset time (vertical black line) is the time when the onset tangent (diagonal solid green line) crosses the initial fluorescence level (horizontal solid green line)

