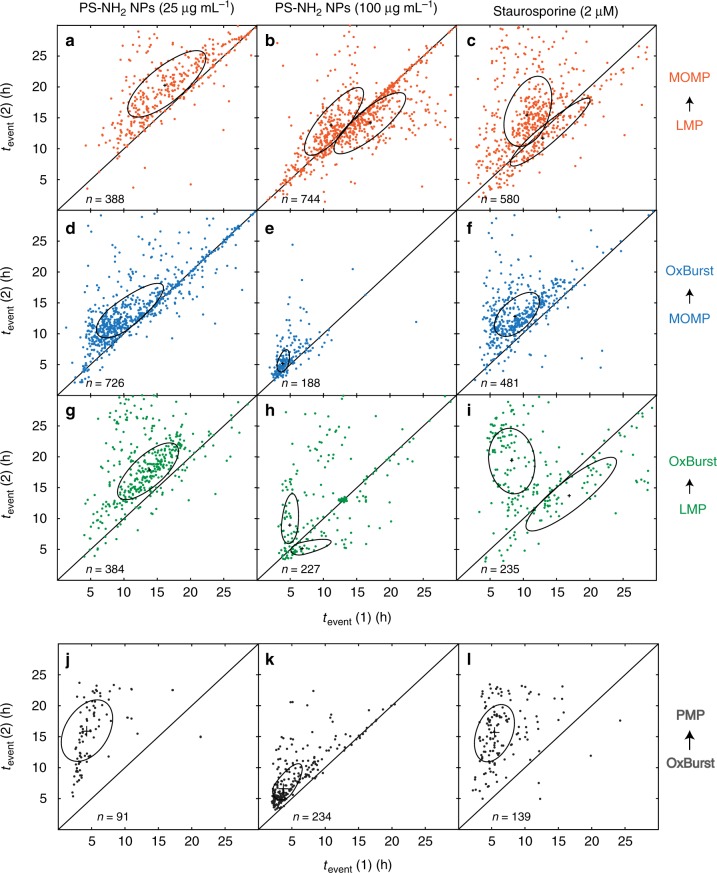
Fig. 4.
Pairwise fluorescence marker correlations of single-cell events in A549 cells. Two-dimensional representation of event times tevent (1) and tevent (2) of pairwise markers induced by exposure of cells to 25 µg mL−1 nanoparticles (left), 100 µg mL−1 nanoparticles (middle), or STS (right). The uniaxially asymmetric ellipses display a one-sigma interval around the cluster center. Mitochondrial outer membrane permeabilization (MOMP) was correlated with lysosomal plasma permeabilization (LMP) (a, b, c) as well as with oxidative burst (OxBurst) (d, e, f). Furthermore, LMP and OxBurst were correlated with each other (g, h, i). Cells treated with 25 µg mL−1 nanoparticles show weaker correlations between OxBurst and PMP (j), whereas a stronger correlation is observed for 100 µg mL−1 nanoparticles (k). A weak correlation is shown for staurosporine-exposed cells (l). n is the number of cells shown in the respective scatter plot

