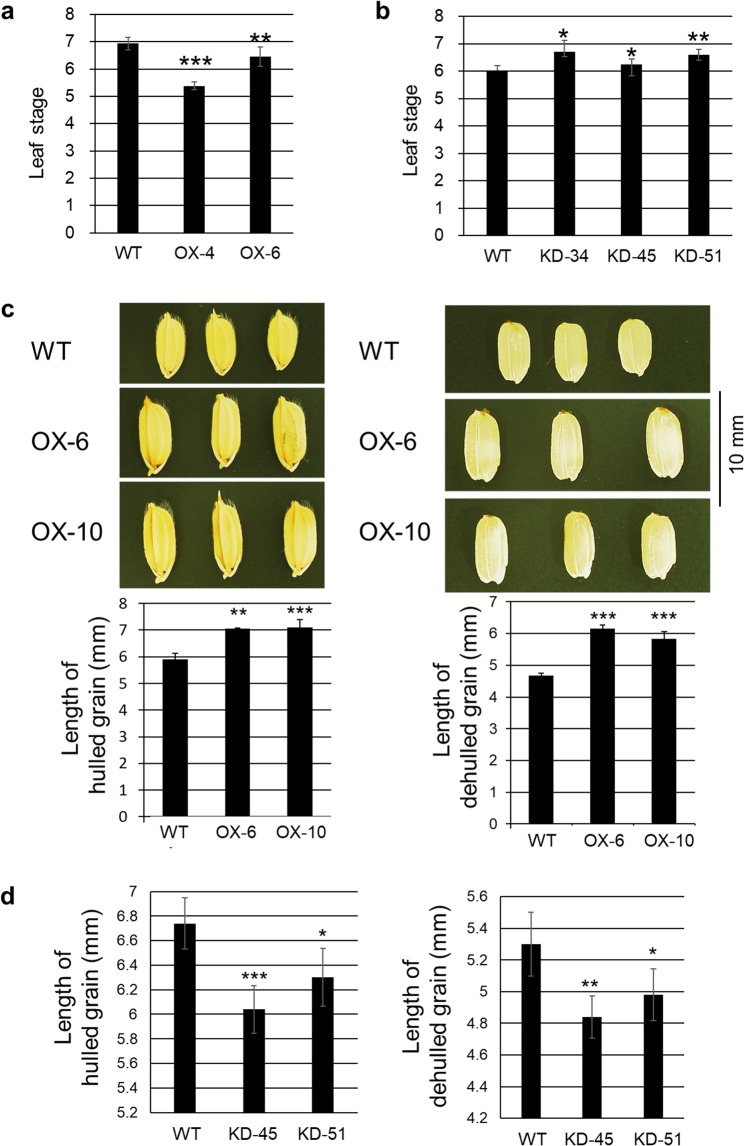
Figure 7.
Morphological traits of BSR2-OX and -KD rice lines. Leaf stages of (a) BSR2-OX lines 40 d after sowing and (b) BSR2-KD lines 32 d after sowing in comparison with WT at the vegetative stage. (c) Comparison of hulled grain (left) and dehulled grain (right) of BSR2-OX and (d) the lengths of hulled grain and dehulled grain of BSR2-KD rice lines in comparison with WT. Asterisks indicate values that are significantly different from the WT (*P < 0.05, **P < 0.01, ***P < 0.001, according to a t-test; error bars represent the standard deviation; n = 5–12 (a), 4–13 (b), 4 (c) and 5 (d)).

