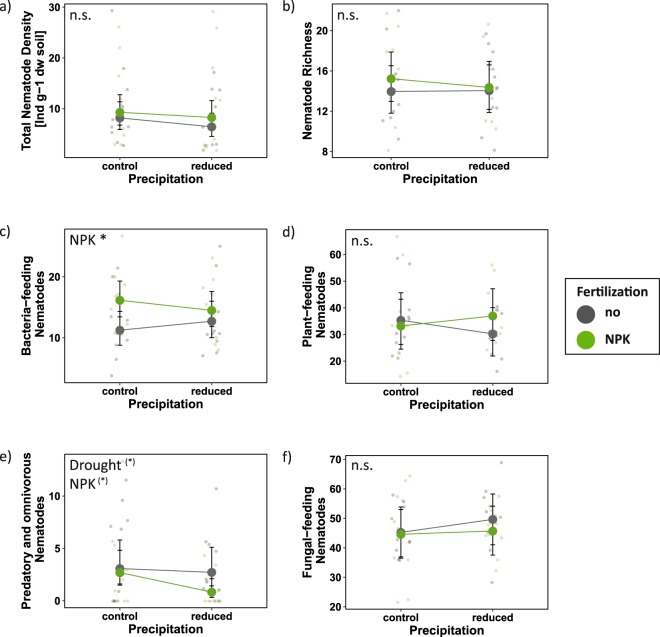
Figure 2.
The effects of drought and fertilization on nematode response variables based on mixed effects model fits for each treatment. (a) Total nematode density per g dry weight soil; (b) nematode taxon richness; percentage of (c) bacteria-feeding nematodes; (d) plant-feeding nematodes; (e) fungal-feeding nematodes; and (f) predatory- and omnivorous nematodes. Error bars indicate 95% confidence intervals. Grey = no NPK fertilization; green = NPK fertilization. Both seasons (spring and summer 2017) are included (see Fig. S7 for seasonal effects). n.s. = not significant; (*)p < 0.1; *p < 0.05.

