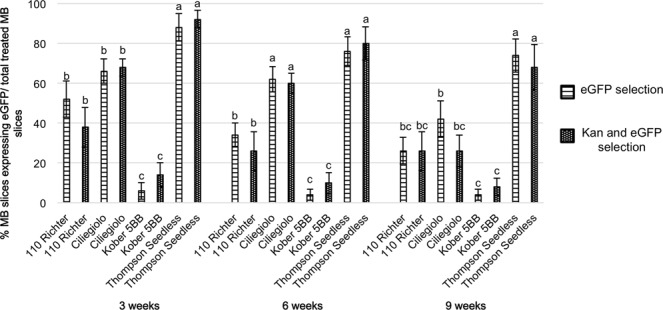
Figure 2.

Percentage of MB slices showing eGFP fluorescence, selected either by the combined use of kanamycin and eGFP screening or by eGFP visual selection alone, after 3, 6 and 9 weeks on culture media. Means with different letters are significantly different according to Newman-Keuls test (p < 0.05) ± SE (n = 50), and compare results obtained from the different genotypes at the same acquisition period. Two independent experiments were performed with similar results. Data reported in the table are related to a unique trial.
