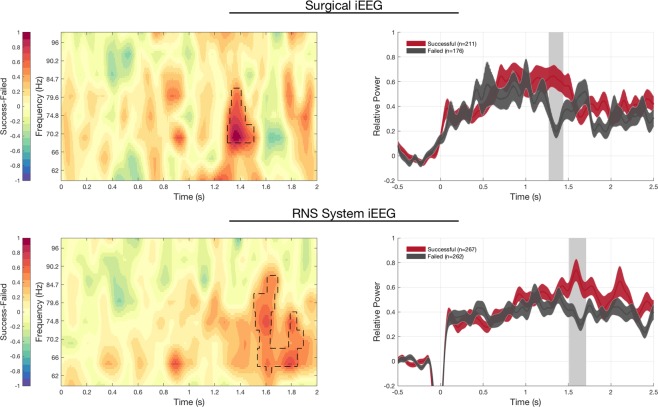
Figure 5.
Hippocampal signature of successful versus failed encoding in RNS System and Surgical patients. Successful encoding shows increased and sustained gamma power in the hippocampus, compared to failed encoding in both RNS System iEEG and surgical iEEG recordings. LEFT. Time-frequency plot show increases in gamma power over similar frequency regions and timescales in successful versus failed encoding trials in both RNS System (top left) and surgical patients (bottom left). RIGHT: Gamma power in hippocampal lead electrodes exhibits a similar time course, with increased gamma power occurring 1.25–1.6 s from stimulus onset in both RNS System (top right) and surgical patients (bottom right; mean +/− SEM; dashed areas in spectrogram and shaded grey bar in the time-course indicates significant differences, p < 0.05 cluster-based permutation test. The drop in in power from −0.1–0.05 s in RNS System data is due to data blanking due to trigger artifact, see Methods).

