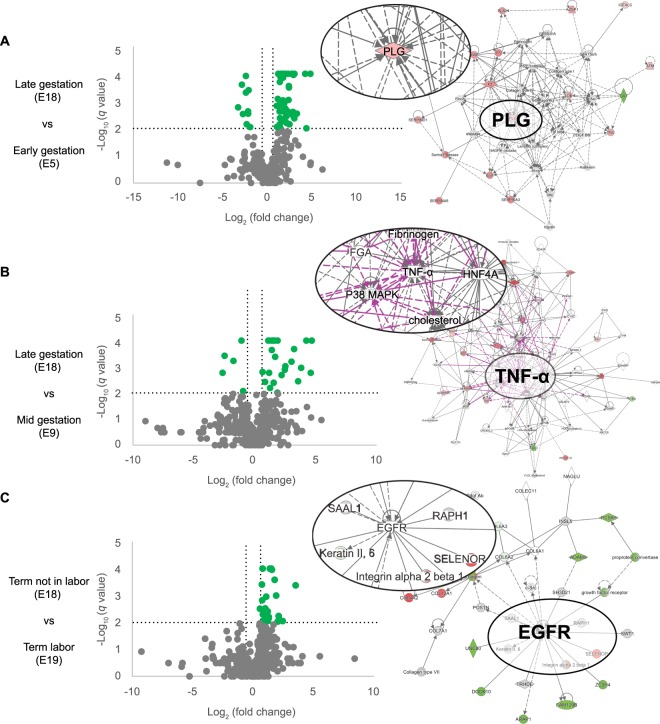
Figure 3.
Volcano plots and molecular networks of differentially-expressed proteins. Molecular networks were identified using Ingenuity Pathway Analysis (IPA) based on proteins with a ±1.5-fold change (log2 fold change = ±0.6) and a q-value < 0.01 (−log q-value = 2). Circular insets are a zoomed in view of the central molecules identified. (A) Comparison of E18 (late gestation) and E5 (early gestation) identified plasminogen (PLG) as a central molecule in the molecular network. (B) Comparison of E18 and E9 identified TNF-α as a central molecule in the molecular network. (C) Comparison of E18 (term not in labor) and E19 (term in labor) exosome cargo identified epidermal growth factor receptor (EGFR) as the central molecule.

