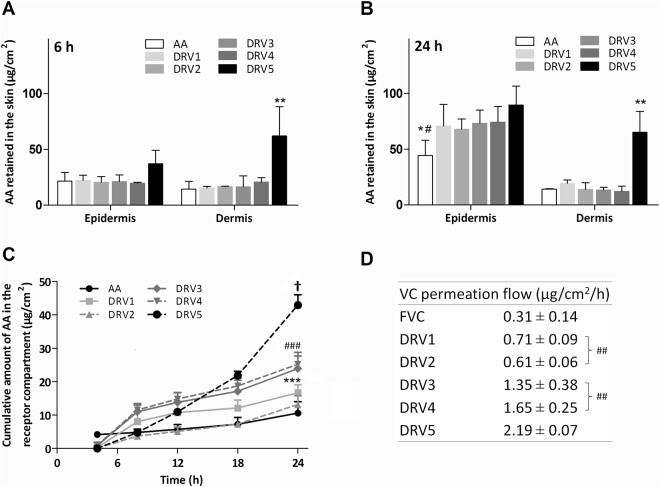
Figure 2.
AA permeation and retention results in pig ear skin. AA (A) 6 and (B) 24 h retention in the epidermis and dermis after application of AA-liposome formulations (DRV) and AA solution (AA). (C) Cumulative amount of AA permeated through the skin per cm2 during 24 h. (D) AA calculated permeation flux. *p < 0.05 free AA vs DRV1, DRV2, DRV3 and DRV4 in the epidermis at 24 h. #p < 0.001 AA vs DRV5 in the epidermis at 24 h. **p < 0.001 DRV5 vs AA, DRV1, DRV2, DRV3 and DRV4 in the dermis at 6 and 24 h. †p > 0.05 DRV5 vs DRV1, DRV2, DRV3, DRV4 and AA. ***p > 0.05 DRV4 vs DRV2 and AA. ###p > 0.05 DRV3 vs DRV2 and AA. ##p > 0.05 flux DRV 1 vs DRV2 and DRV3 vs DRV4. Intrinsic AA present in pig skin is not represented in the graph for being under the method’s LOQ. Values are represented as mean ± SD.

