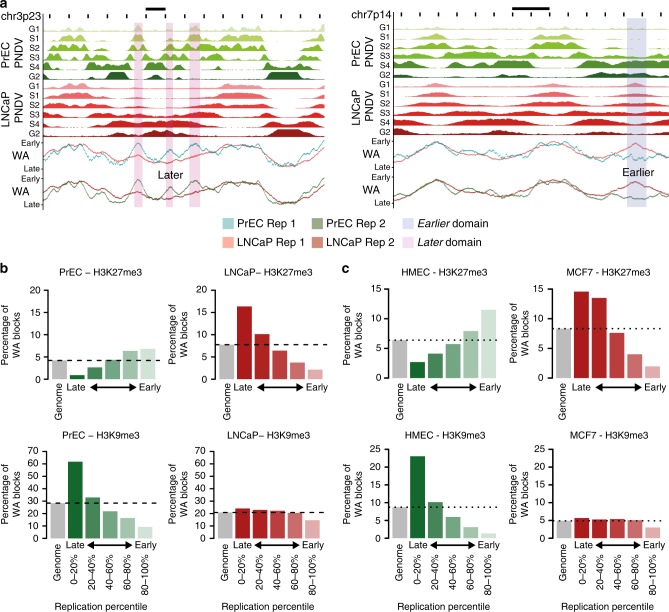
Fig. 1.
Relationship between chromatin and replication timing in normal and cancer. a Representative examples of regions of timing change between PrEC and LNCaP. PNDVs for PrEC (green) and LNCaP (red) are shown in the upper panels. The summarised WA values for each replicate are beneath. Regions that replicate later in LNCaP (ΔWA < −25) are highlighted in pink. Regions that replicate earlier in LNCaP (ΔWA > 25) are highlighted in blue. Scale bars represent 1 Mb. b Percentage occupancy of chromatin marks for 1 kb loci (WA blocks) within replication timing percentiles for repressive marks H3K27me3 and H3K9me3 in PrEC and LNCaP. c Percentage occupancy of chromatin marks for 1 kb loci (WA blocks) within replication timing percentiles for repressive marks H3K27me3 and H3K9me3 in HMEC and MCF7

