
Figure 4.
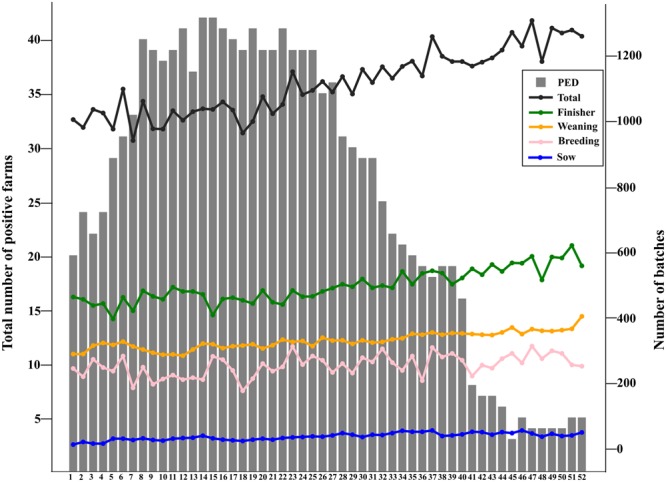
Total number of Porcine Epidemic Diarrhea virus-positive farms and total number of movements into neighborhoods per week in 2014. Number of movements by movement type are represented as colored lines.
Official websites use .gov
A
.gov website belongs to an official
government organization in the United States.
Secure .gov websites use HTTPS
A lock (
) or https:// means you've safely
connected to the .gov website. Share sensitive
information only on official, secure websites.
Total number of Porcine Epidemic Diarrhea virus-positive farms and total number of movements into neighborhoods per week in 2014. Number of movements by movement type are represented as colored lines.