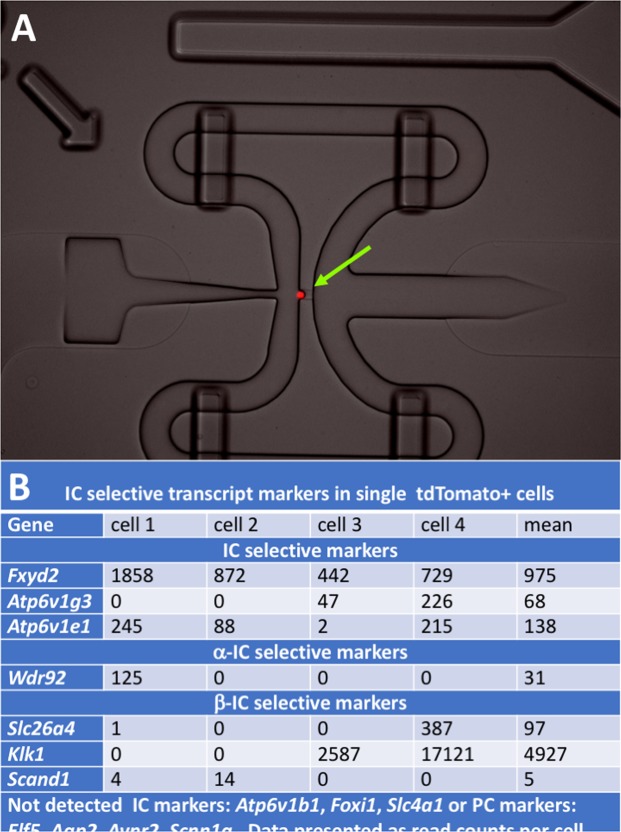
Figure 5.
(A) Imaging of tdTomato+ single intercalated cell (IC) captured on medium size (10–17 µm) IFC plate. Bulk ICs were sorted from IC reporter (V-ATPase-cre x tdTomato) mice with Flow sorting. Cells were pelleted, counted and suspended in Fluidigm cell suspension reagent at 3:2 ratio at 200 cells/µl concentration. Pooled cells were separated to single IC cells on Fluidigm C1 system and imaged under fluorescence microscope at 20X magnification. (B) Expression of IC markers. Base on the expression patterns of α-IC and β-IC markers, we estimate that cell 1 was a α-IC while cells 2–3 were β-ICs.

