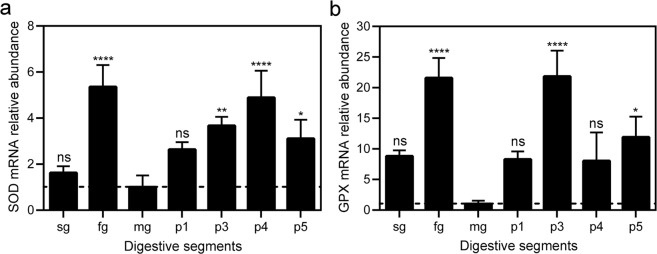
Figure 3.
Relative abundance of antioxidant enzyme mRNAs along C. cumulans digestive system. (a) SOD mRNA levels; ns = no significance, ****p < 0.0001, **p = 0.0085 and *p = 0.0438. (b) GPX mRNA levels; ns = no significance, ****p < 0.0001 and *p = 0.0249. Salivary glands (sg), foregut (fg), midgut (mg) and hindgut compartments – p1, p3, p4 and p5. Analyses were performed using qRT-PCR and the 2−ΔΔCT method, with HSP-70 as the housekeeping gene and the midgut as a reference sample. The data shown are mean ± S.E.M. from nine replicates with ANOVA and Dunnett’s multiple comparisons test.

