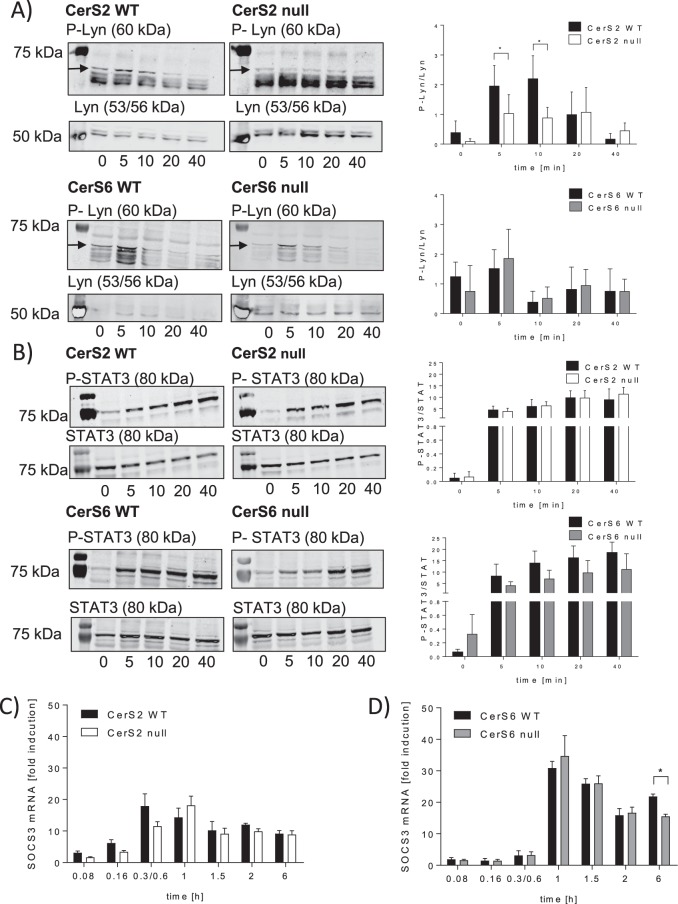
Figure 4.
Downstream signaling of G-CSF is regulated in a CerS2-dependent manner. (A) Western blot and densitometric analysis of P-Lyn kinase (60 kDa) and Lyn kinase (53/56 kDa) (B) P-STAT3 (80 kDa) and STAT3 (80 kDa). Bone marrow cells (BMCs) from WT, CerS2 null and CerS6 null mice were incubated for 5, 10, 20 and 40 min with 10 ng/ml G-CSF and the phosphorylation of Lyn kinase and STAT3 was determined using western blot. The relative phosphorylation status of the kinases and the transcription factor were calculated using the unphosphorylated protein as reference. (C,D) Time dependent SOCS3 mRNA expression in WT, CerS2 null or CerS6 null cells stimulated with G-CSF. The mRNA expression levels were normalized to peptidyl propyl isomerase A (PPIA) and were calculated using the mRNA level of untreated cells at time point 0 h. A representative western blot of three is shown. Blots are cropped to the areas of interest. Phosphorylated Lyn/STAT3 and unphosphorylated protein were detected on the same blots using different secondary antibodies. Full-length blots are enclosed in Supplemental 5. The densitometric analysis represents the data from three independent experiments. For one experiment, BMCs from two mice were pooled. The mRNA experiments were repeated at least six times and were done in triplicate. Data are means ± SD (A,B) and ± SEM (C,D). *(p < 0.05), **(p < 0.01) and ***(p < 0.001) indicate significant differences between WT cells and CerS2 null or CerS6 null cells analyzed by t-test.

